Best Buy (BBY) has been an interesting stock to play over the years; it certainly has had its ups and downs!
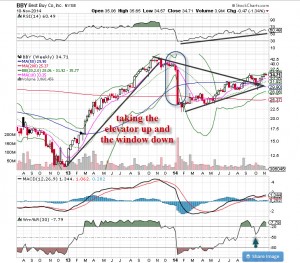
We can see from the weekly chart below that the swings since 2012 have been wild. However, the stock is now poised for a big run that could last through the new year. The momentum and price action have been steady all year, and it just broke out of a triangle wedge formation with volume to the upside.
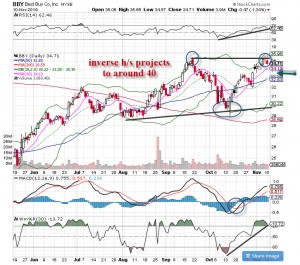
The daily chart shows a bullish inverse head/shoulders pattern that, once the neckline is broken, projects to about $40 or so. The momentum indicators are mostly overbought, but the price is stubborn at this level and could continue higher. As an options trade, we added some Jan 35 strikes on 11/11.


