As the sun sets on 2014, we need to spend a little time reflecting on the market action, charts, patterns and technicals. After all, it is time frames that are most important, and a completed calendar year is an ideal moment to evaluate previous trends and see if they will continue or change.
As I mentioned in this article last week, I use this time to evaluate where the Federal Reserve is positioned. I can say unequivocally that the Fed is still accommodating and continues to want us in risk assets. They may raise rates somewhat in the year ahead, but inflation is contained, and that is the only true threat to bringing us a hawkish Fed.
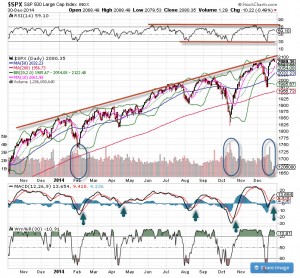
During our weekly webinars, I always start off looking at the SPX 500. Looking at the 2014 chart, we can see the SPX had a nice, steady rise with a few hiccups along the way. As we see from the sharp and deep drops over the last 12 months, there was far more volatile action than during the prior two years. The index will finish up double digits for the second straight year, an amazing feat following the stellar year in 2013.
We can see on the daily chart the many higher highs and the big dips that provided outstanding buying opportunities. Most of these moments were coupled with oversold readings in the MC oscillators, off-the-chart highs in the VIX, and put/call ratios and spikes in volume that resembled capitulation. This is a marked change from 2013, and since volatility is low and news seems to cause an adverse reaction, we could have similar action in 2015. The key here is being prepared and ready to buy those dips; when we reach overbought conditions, we must be willing to sell or buy protection.
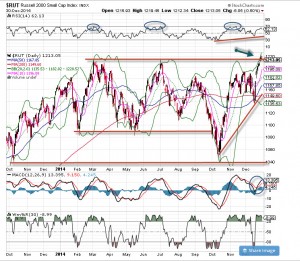
The second chart is the Russell 2K, and I chose this one because it shows the choppiness that is not seen in other indices. The range is wide – from 1214 to 1040 – and playing the tops/bottoms game could have paid off nicely. That is not my game and it is a dangerous one for a premium buyer. For the premium seller, the volatility is a big bonus – but you don’t want to get stuck in a big move up or down. A smooth trend is much more reliable for profits.
We see the Russell 2k is now at the top of the range, but more importantly, it has been hanging out above that range. If this continues early in the new year, then it tells us range expansion is very possible. The MACD is on a buy signal and the RSI is giving us a nice chance to get in here. While it’s hard to buy at all-time highs, the momentum is very strong. A pullback to the trendline at 1150 would not be a surprise.
As January goes, so goes the rest of the year.
This anecdote about January did NOT hold true in 2014. The month was atrocious and knocked everyone for a loop before buyers started coming on board in February. There is another anecdote about years ending in ‘5’ – since 1885 there has only been ONE down year. I’m not sure how this one will play out, but we’ll see during our next year-in-review on December 31, 2015.
Happy and Safe New Year!


