On Apr 16 after the close, I will be talking more about this topic in depth, sign up for it here – https://attendee.gotowebinar.com/register/6841138622700438786
Famed investor George Soros once said, “The biggest profits to be made are in the fat tails.” What on Earth did he mean? Here’s everything you need to know about one of my favorite options income strategies.
As defined by the book “Inside the House of Money” by Steven Drobny, fat tails are anomalies in normal distributions; they are extreme occurrences that are tough to explain theoretically. Because markets are governed by human behavior, under-and overreactions to various data and indicators, coupled with the herding instincts of traders, sometimes push prices to extremes. These extremes occur infrequently, but they definitely happen.
It’s time for a little statistics refresher. A normal distribution has a defined mean (average) and standard deviation (strength of movement). We can define a range of data points (the more data, the better) under a normal distribution and place brackets or bands where most of the data will likely fall. Two standard deviations captures 95% of where those data points will live; the 5% of the data that lie outside the bands (think bollinger bands) are the outliers – or fat tails. See the chart to the right for a graphic representation.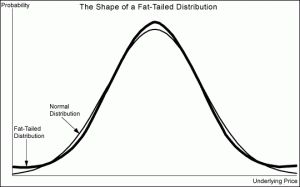
Why is this important? From an options trading standpoint, the 5% is where the big money can be made. This is where price acceleration really happens – stocks in the fat tails can move like rockets in the direction of the trend – and as an options trader, I need this movement to overcome decay. Trading fat tails is one of the best options income strategies, as it combines math, sentiment, and participation (or lack thereof).
You might be wondering what a stock chart has to do with a normal distribution. Well, a chart is simply a normal distribution tilted 90 degrees. If you put defined bands around the price, then you create a distribution of data points in time and price. The chart is also a sentiment reader as well, showing you a full spectrum of fear and greed. These emotions determine our moves based on expectations. The more fear, the less participation. The more greed, the greater the participation.
Naturally, price will not “hang out” in the 5% fat tail area for too long, but when you do identify it, it CAN stay there long enough for a highly profitable option trade. When I look at a stock chart, I look for potential acceleration, speed, velocity and movement. This is counter to what conventional wisdom says to look for, but again, it’s about statistical probabilities.
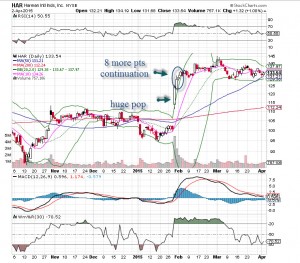
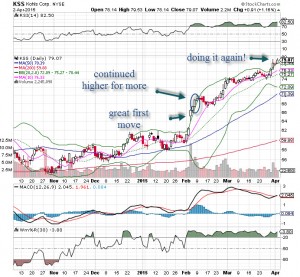
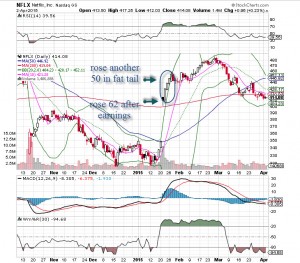
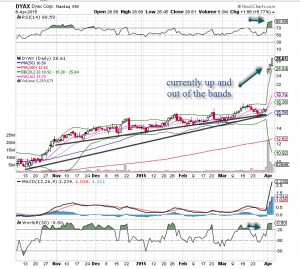
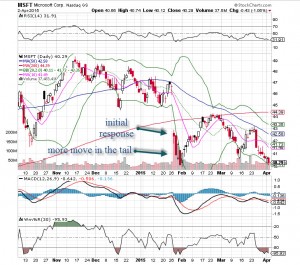
Take a look at the charts below of Kohl’s (KSS), Dyax (DYAX), Harman (HAR), Netflix (NFLX) and Microsoft (MSFT). See how these stocks made big moves AFTER landing in the fat tail? Playing that move while a stock is in the fat tails can be a very lucrative move – and one of your best options trades ever.


