As an options trader, I search for certain qualities in the charts. Knowing that time is against me when I buy options, I want a chart that shows some quick price movement in a short period of time. It’s very tough to find, and when there is not a catalyst to drive a price higher (or lower), then the reasons to trade the name are even fewer.
What I’m essentially looking for are fat tails, one of my favorite options income strategies that I will cover in more detail in an upcoming blog post. In a fat tail, price lives in the 5% range outside the normal distribution of data points; in trading parlance, the price is outside the Bollinger bands. This is a rare find, but it’s an ideal situation for an options trader who is looking for speed and acceleration in the chart.
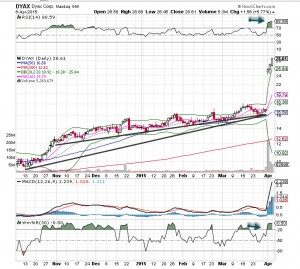
Last week, Dyax (DYAX), a biotech company based in the tech corridor outside of Boston, shared some positive news that vaulted the stock nearly 70% on extreme volume (more than 25x normal turnover!). That movement caught my eye, but what really got my attention was the explosion in price. If you look at the Dyax chart to the right, the stock has continued to live outside the Bollinger bands, and it continues to push higher. Dyax will not stay here for long, making this a great short-term trade.
To learn more details about the Dyax chart – and trading the fat tails – watch the video below.
Dyax Chart Analysis
Take a deeper dive into the chart action and learn how to read the technicals as I walk you through the Dyax stock (NASDAQ: DYAX) and my analysis as mark up our chart of the week.
Love what you’re learning in our market analysis? Don’t miss a single video! Get the latest chart action delivered directly to your inbox every week!


