Last week was a difficult one for markets, which I realize is probably a gross understatement. The SPX 500 fell a stunning 5%, and the Dow Industrials dropped 3%, or more than 530 points. It was the worst week in nearly a year, and it set the indices back – way back.
That drop seems like a big move down, doesn’t it? To put 3% into context: In 1987, the Dow Industrials dropped a similar amount (508 points), but that was a massive crash – it went down 22% in one session. By the end of the week, the Industrials lost about 1,000 points, and it happened with amazing speed.
People are feeling spooked after last week, and I get it. I was asked several times on Friday, “Where will the slide end? When will it end?” It was almost as if some traders were trying to time the bottom. That is not my game, so I had to ignore the questions and the guessing that ensued. When a market makes extreme moves in an emotional outburst, you can pretty much void any support and resistance lines. Looking for those are futile, because price will slice through those levels like a hot knife through butter.
We have been talking about the problems in the markets for a few weeks now in both our chat room and with Explosive Options members, so this move down was not a surprise. The price action was bad, but we saw some other statistics that were simply off the charts. Because we knew something was coming, we decided to be proactive and take on some protection. We bought a week ago when it was cheap and the VIX was at 12%. It paid off this week – bigtime.
First things first: Will there be a rally? Of course there will be a rally, but it’ll come when you least expect it. With options, you need to be ready. Watch the indicators and wait for them to hit extremes. The key is waiting; trying to time a rally is a useless exercise. Wait for the turn, confirm a new trend is in place, and then go with it. (Because Friday was a 90% down day, that sets us up for a snap back rally.)
Let’s take a look at the indicators:
McClellan Oscillators
The McClellan Oscillators are as negative as they have been all year long, and now they point toward a reversal to come. Don’t get too excited, though: the bears are leaning very heavily on this market. I suspect we’ll have some relief this week, but it’ll be difficult to get on board with so much damage done.
VIX
The VIX, which represents market volatility, moved up an incredible 100% in three sessions last week, reaching levels not seen since last fall. On Friday, the VIX pushed higher by 46%, a sharp move not seen in years. The term structure is now forcibly going backwards. With these kinds of spikes, we’ll hit exhaustion, and there will be a reversal, but again, we’ll wait for it and not anticipate it.
CNN Fear/Greed Index
The CNN Fear/Greed Index has clocked in at 5; I’m surprised it’s not lower, but that is still in very extreme territory. The new 52 week lows list is off the charts, coming in on Friday at 715 vs ten new 52 week highs.
The three month chart is even more stunning, nearly 1,000 new three month lows (at the start of this time frame, the SPX 500 was at an all time high!) 
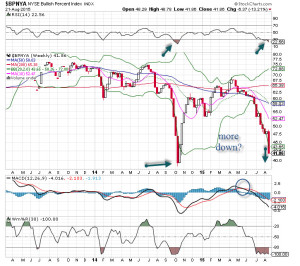
The most damaging statistic here is the bullish percent, which is why it’ll be so hard to overcome this concentrated drop. The line in the sand had been 50 (see chart), but when that busted, the dam broke. (Bullish percent is a breadth number for point/figure chartists; it measures the percentage of stocks within a particular group that are on Point & Figure buy signals.)
Are we facing a bottom like we did in October? We are not quite there yet, but it is possible. Instead of guessing, though, let’s wait and see what happens – and respond appropriately.


