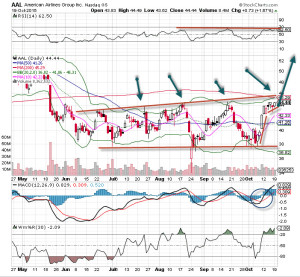
Airline stocks have been flying high lately, perhaps consumers are showing signs of life again and are ready to travel. Oil prices are still down, which certainly helps margins, but even more important is that carriers have reported heavy load numbers. This means butts are in seats and potential profits are good. Other airlines have been performing well, including Delta (a prior chart of the week), but American Airlines is poised for some upside.
American Airlines Stock Chart (NYSE: AAL)
The chart of American Air is constructive, but it’s also bound by brackets and stuck in a range. However, a recent test of the upper range may take the stock even higher toward the May gap at 49 or so. Relative strength is impressive, though it may be due for a pullback and money flow has been improving. MACD has switched over to a buy signal, so when the stock pushes over 45, we’ll be looking for a good entry point.
American Airlines Video Chart Analysis
Take a deeper dive into the chart action (NYSE: AAL) and learn how to read the technicals and my analysis as Bob Lang marks up our chart of the week.
Love what you’re learning in our market analysis? Don’t miss a single video! Get the latest chart action delivered directly to your inbox every week as Bob breaks down stocks to watch and potential trade options!
About American Airlines
American Airlines Group Inc., through its subsidiaries, operates in the airline industry. As of December 31, 2014, the company operated 983 mainline jets, as well as 566 regional aircrafts through regional airline subsidiaries and third-party regional carriers. It serves 339 destinations in 54 countries. The company was formerly known as AMR Corporation and changed its name to American Airlines Group Inc. in December 2013. American Airlines Group Inc. was founded in 1934 and is headquartered in Fort Worth, Texas.


