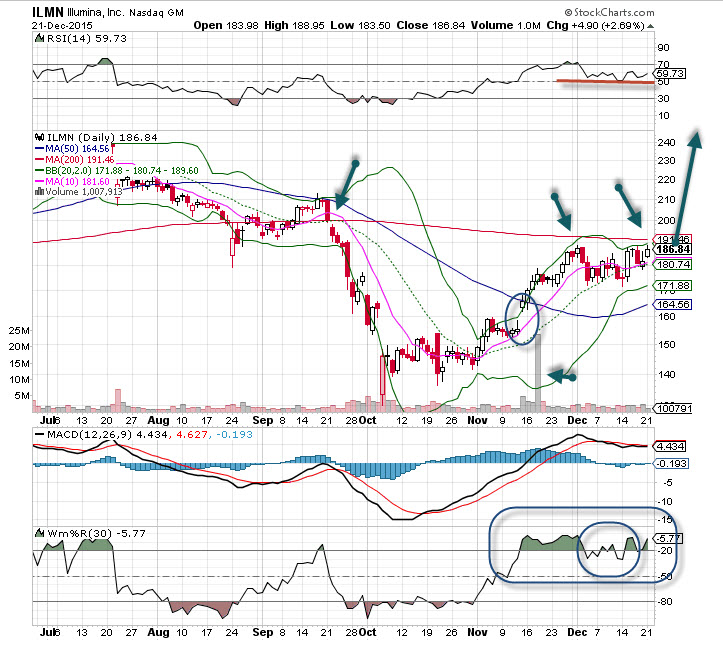
Biotechs have been some of the most volatile stocks in 2015, and Illumina has definitely been one of those. After dropping precipitously in September, it has made its way back toward the 200 ma for the third time. The time, though, Illumina may push through heavy resistance. (It’s worth keeping in mind that this name is barely up for 2015 – a true laggard.)
If we can see Illumina penetrate the resistance at 191 or so, it could have clear blue skies ahead. There’s a gap to fill at 198, which should happen on the next move upward.
The MACD has flattened out, but it is still on a buy signal, as the up days have been on stronger turnover. I particularly like the momentum indicator below, where we see a few chances to get on board before buyers hustle in.
Illumina Stock Chart (Nasdaq: ILMN)
Illumina Video Chart Analysis
Take a deeper dive into the chart action on Nasdaq: ILMN and learn how to read the technicals and analysis as Bob Lang marks up our chart of the week.
Love what you’re learning in our market analysis? Don’t miss a single video! Get the latest chart action delivered directly to your inbox every week as Bob breaks down stocks to watch and potential trade options!
About Illumina
Illumina, Inc. provides sequencing and array-based solutions for genetic analysis in North America, Europe, Latin America, the Asia-Pacific, the Middle East, and South Africa. The companys products include sequencing platforms that are based on its SBS technology, which provides researchers with various ranges of applications and the ability to sequence mammalian genomes; and array platforms consist of HiScan and iScan systems, as well as NextSeq 550 system that are array scanners for DNA and RNA analysis applications, including single nucleotide polymorphism genotyping, copy number variations analysis, gene expression analysis, and methylation analysis.


