In 2013, Jim Cramer asked me to help put together an Off the Charts segment on Mad Money. At the time, the market was a getting ready to launch to new heights, and it was clear we needed to look at growth stocks. The names we selected were Facebook, Amazon, Netflix and Google – the poster children for technology and growth. Using the first letters of each name, we came up with the acronym FANG. The clip from that show is below.
Every once in a while, I like to check in and see how these stocks are performing. For the most part, these names have held up quite well. In fact, all four names are within spitting distance of new all-time highs. Where did market players go during last Wednesday’s market surge? You guessed it: FANG. These companies tend to move markets more than we could ever imagine. Three of them are in the top 10 valuations (by market cap) in the US.
Let’s take a look at each company, along with its monthly chart, to see how far these stocks have come since 2013.
FANG stocks have plenty of bite
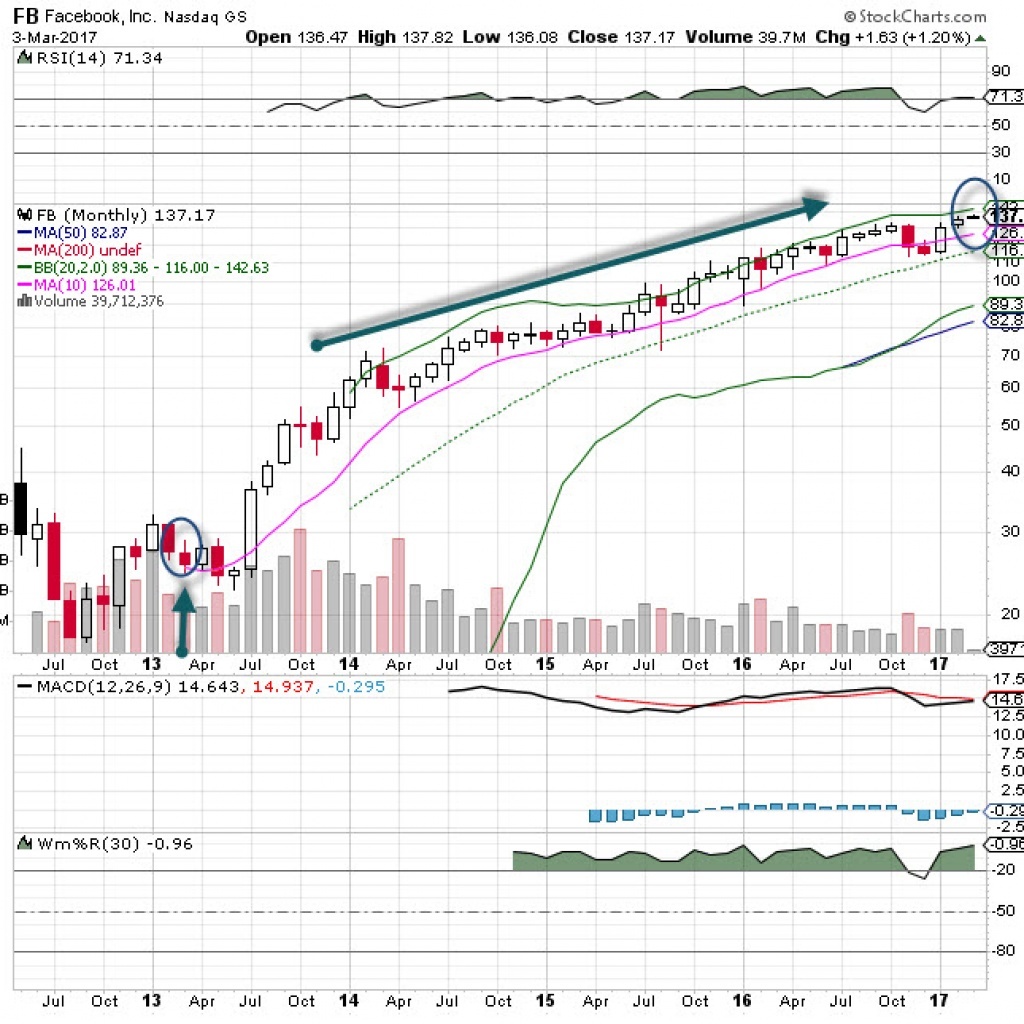
Facebook has been a huge winner. In 2013, the stock was in the mid $20’s, just coming off an embarrassing move down to less than $20. Barron’s had just published a bearish article saying Facebook was heading lower. To underestimate Mark Zuckerberg, his team, and Facebook’s more than 1 billion users was a bad move.
Today, the stock is almost at $136, a nearly 500% increase. The current chart is constructive, as it bases the stock at a higher level. We could see more upside if the economy continues to remain buoyant.
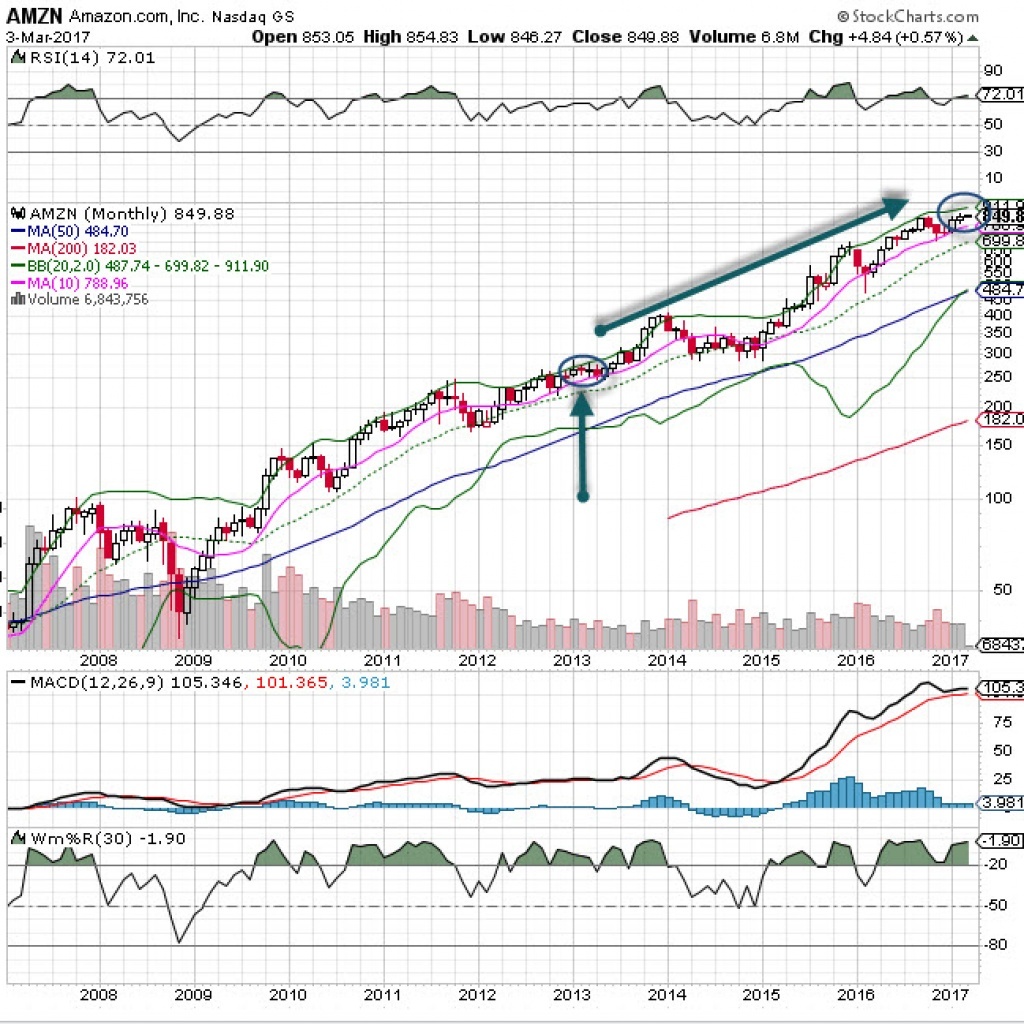
Amazon has been simply amazing. Since we first covered the FANG stocks, the company has rolled several new services, including AWS and Amazon Prime, crippling the traditional retail model.
The stock is up more than 200% since we talked about it four years ago, and we still think there are more highs to be made. The stock is less than 2% away from all-time highs.
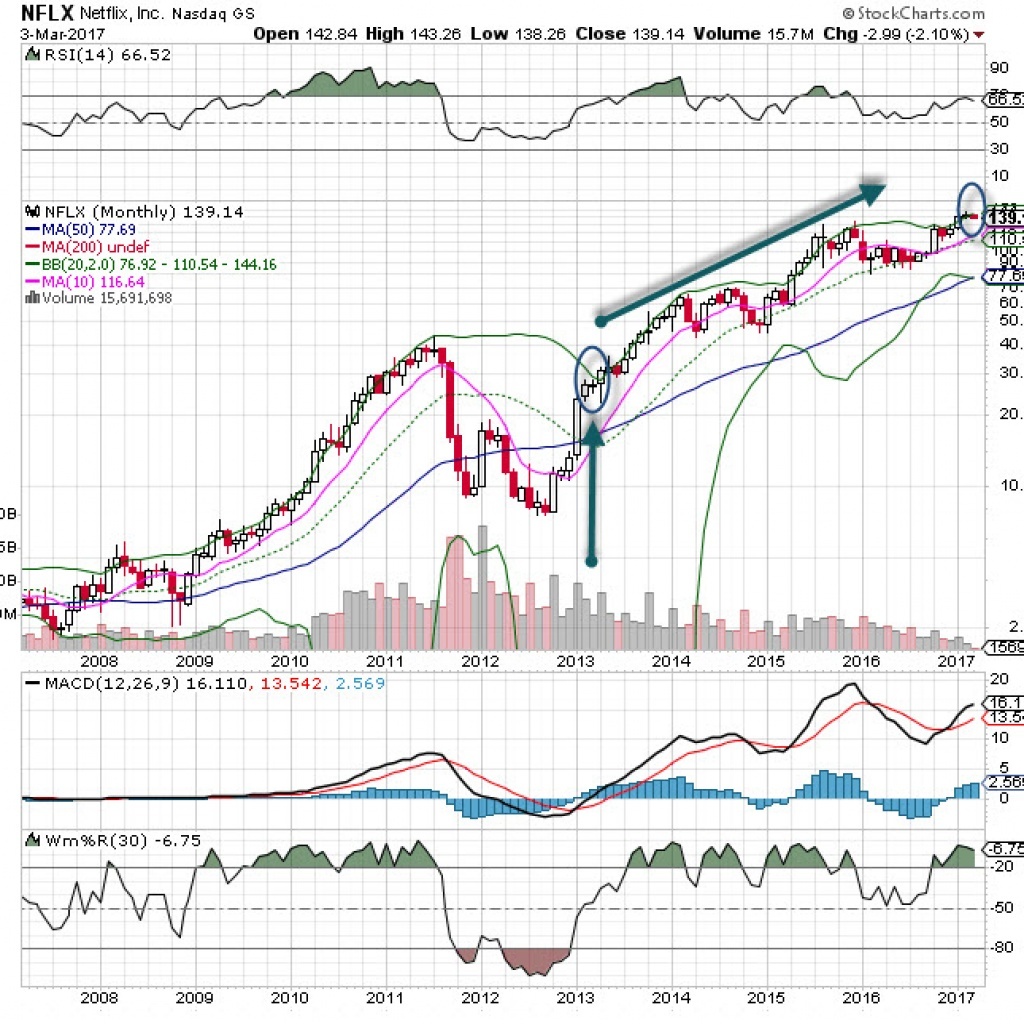
Netflix was a controversial name when Jim Cramer talked about it in 2013, but it has moved the most of all the FANG stocks. It was the most bullish chart pattern I found among the four names, and for good reason: heavy institutional buying.
The stock is up more than 750% (adjusted for a 7-1 stock split), and its business has never been better. The transition to a digital model and original programming has positioned Netflix as a market leader – but more competition is coming from Amazon, Apple and Hulu, among others.
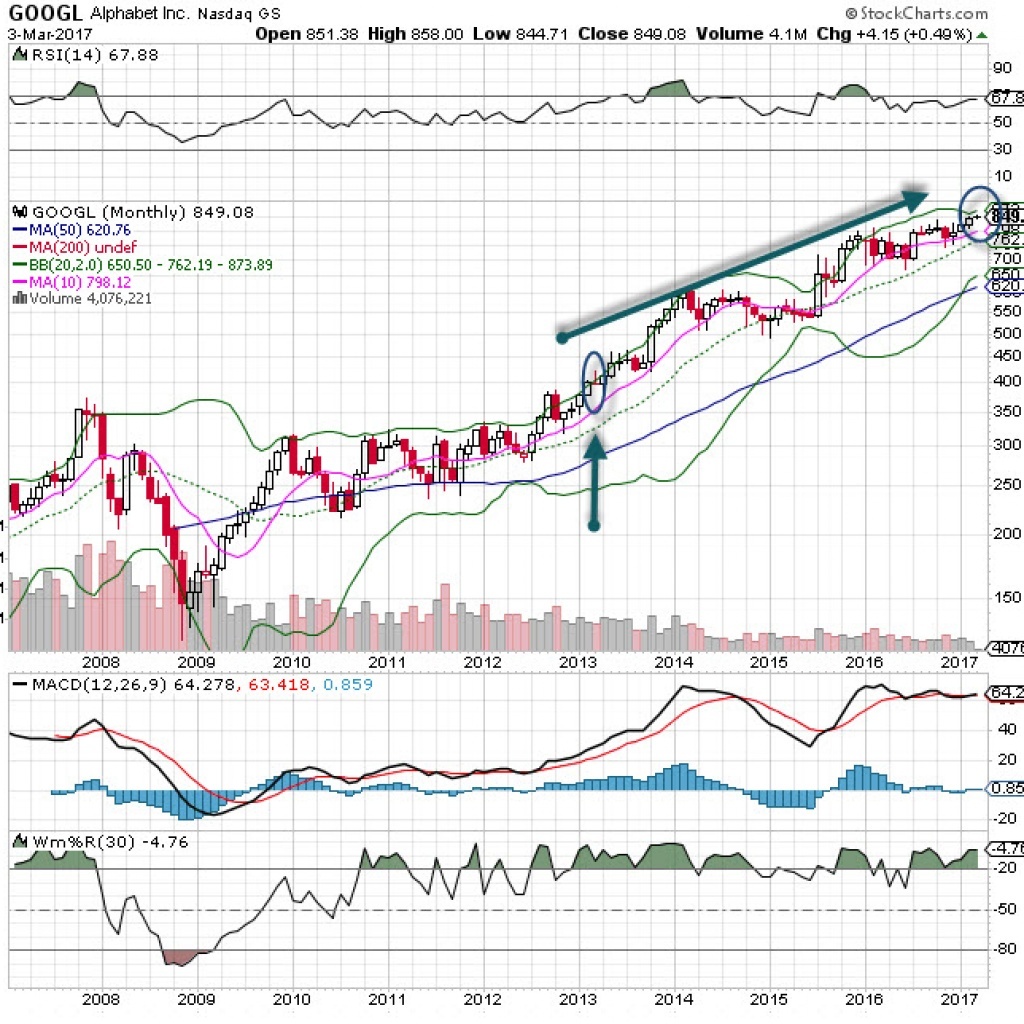
Google has been consistent; it’s up 110% or so. The stock split a couple of years ago, so there are two classes of shares now. The company is a font of new ideas, continually developing new revenue streams and attracting eyeballs and advertisers. It is clearly the dominant player in its field with an enormous bench of talented leaders. The stock is well positioned to break out to new highs.
Bottom line: the FANG stocks have been a great place to invest. Since February 2013, the composite return of equal weighted positions is up more than 430%, truly an amazing run. In comparison, the SPX 500 is up about 55%, while the Nasdaq 100 composite is higher by about 80%.
With some renewed vigor and interest in the stock market, I suspect money will be flowing to some of the more solid names, like FANG, which are bound to beat the market return.


