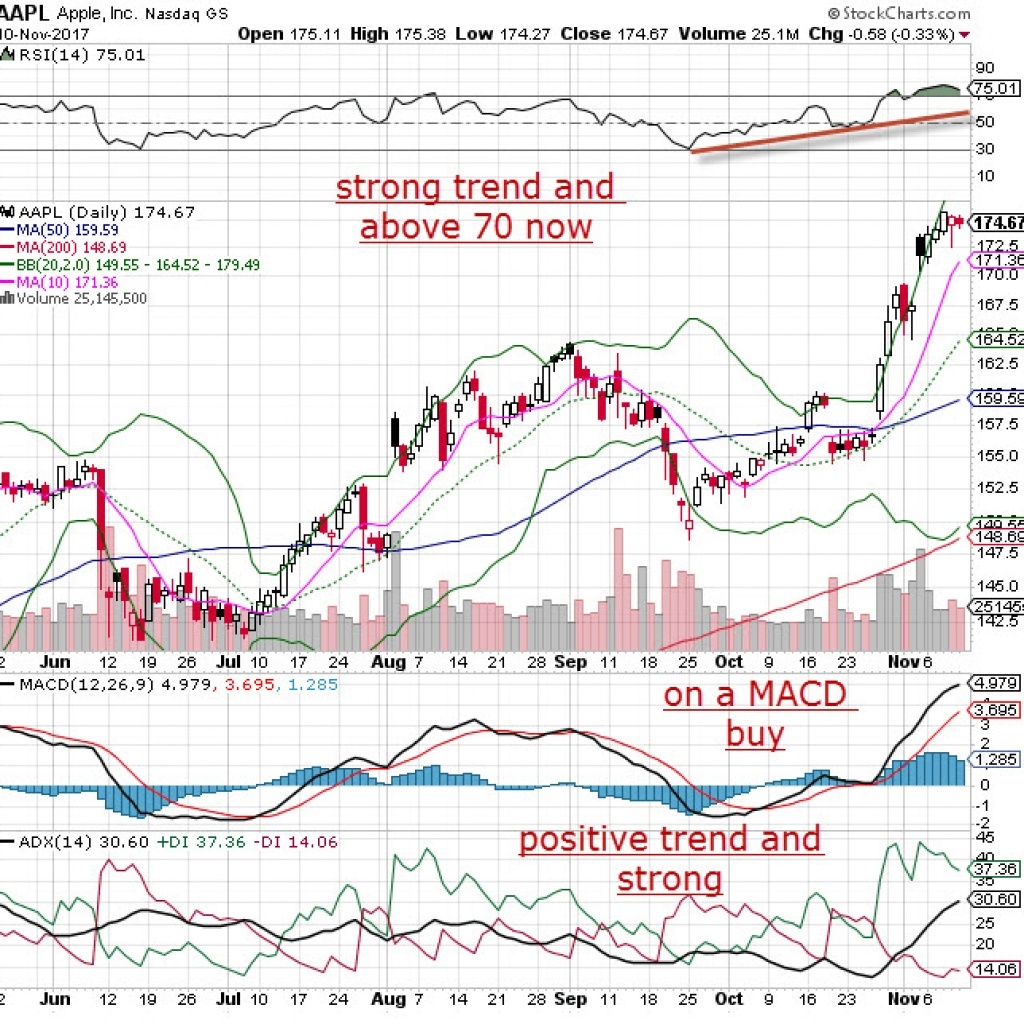
As an options trader, I follow many technical indicators to guide my trading: Price, volume, option flow, sentiment and momentum (for individual stocks and indices). By tracking momentum, I can see powerful moves set up ahead of time. Ideally, I get on board just before these surges happen.
But isn’t that market timing? As you know, I think that trying to time a market is a foolish strategy. Nobody can predict behavior, and nobody can consistently or correctly time markets.
Looking for a market surge and turning it into a profitable trade is not timing the market. It’s just a smart strategy.
I look at prior patterns (including predictable human behavior), create a strong thesis and go with it. My thesis takes into account that nothing is perfect and a future event can invalidate it, but I have found that moving with the direction of the market’s tide can be profitable.
Momentum is like a long ocean wave. I want to ride it for as long as possible. Trying to predict when it ends is a distraction. I watch the charts and indicators for signs the wave is losing steam, and I adjust my trading strategy accordingly.
3 tools for tracking momentum
While there are a slew of indicators that show momentum from different angles, I prefer to use three traditional gauges, which you can see in the Apple chart below.
Relative Strength Indicator (RSI)
I like to start with the RSI, which graphs how a particular stock is doing price-wise versus an index. It was developed by famed technician Welles Wilder to measure the speed and change of price movements. If believe that momentum continues once it’s established, then the RSI is your tool.
I use a 14-period indicator and look for higher lows and higher highs. Eventually, I want to see an embedded reading that stays above 70 for a while.
Moving Average Convergence Divergence (MACD)
The MACD is predictive; it shows a change in the stock’s trajectory before it occurs. I use the standard 12-26-9 setting and look for crossovers on the histogram. Whether the momentum is up or down, this tool is valuable in helping to identify a trend before it happens.
Average Directional Movement (ADX)
Finally, I like to use the ADX, another indicator created by Welles Wilder. This tool shows the strength of a price trend by considering both positive and negative directional movements. The ADX is an average of the two, and the stronger the ADX over 14 periods (my setting), the better and longer lasting the trend will be.
I look for readings above 25 on the ADX, which tells me that trend (not direction) is particularly strong and may last for quite some time.
Technical tools provide you facts about a stock’s movement. It’s up to you to analyze the data and identify the stocks with the best momentum. Use these tools to complement the others in your analysis toolbox.
Copyright: chrisvanlennephoto / 123RF Stock Photo


