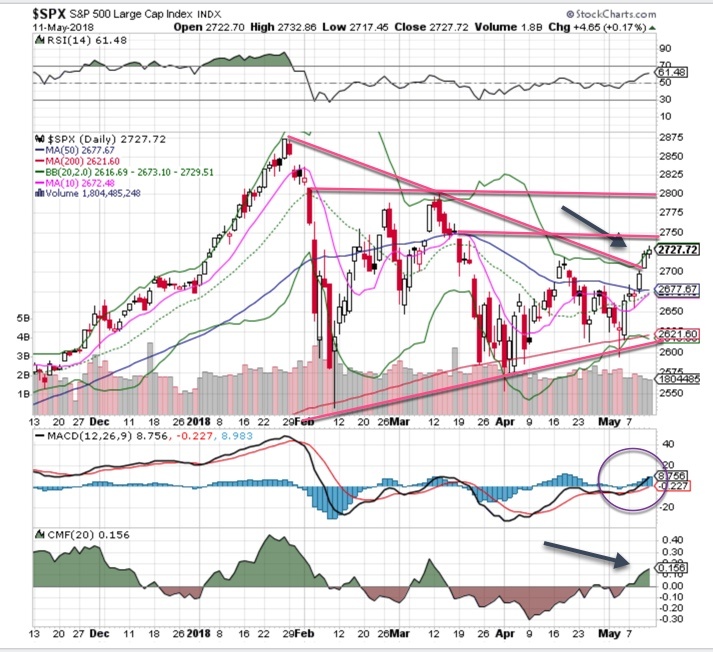
After four months of bearish activity, it appears the recent correction may be ending. It’s a bit early to declare total victory over the bears, but the evidence provided by the charts and technicals looks bullish. Naturally, a tweet storm or geopolitical messiness could unhinge the market, but we must live with that uncertainty.
Charts and technicals are giving off bullish signals
Here’s what I’m seeing:
We’re sitting towards the type of the market’s range.
The big range we have seen in the markets continues, but we are now sitting towards the top end of it with only a mild overbought condition.
Corrections usually last for a period of two to four months, so we are exiting right on cue. The chop in the SPX 500 (see chart below) indicates a volatile period starting in early February. The wide ranges since then have narrowed considerably, and a bottom around the 200 ma has been tested. It appears those tests were successful, so at this point, we can expect more upside on the chart.
We’re seeing higher lows and higher highs.
Last week’s close above the April high was key, but the higher low and higher high from Friday confirmed bullish activity. That’s not to say we won’t backslide a bit – we may be quite overbought later in the week. However, a pullback may set up a new higher low on the chart, maybe to the 50 ma (which might seem scary to some, but that’s where the markets were five days ago!).
Indicators are bullish.
The MACD is on a confirmed buy signal, and money flow is positive for the first time in a couple of months (and it’s building). Price is above the upper bollinger band for the first time since January, and the bands have started to trend higher. This is another arrow in the bulls’ quiver.
Even though things are looking bullish, this is definitely not the time to get complacent. Keep your emotions in check, and let the markets guide your trading.


