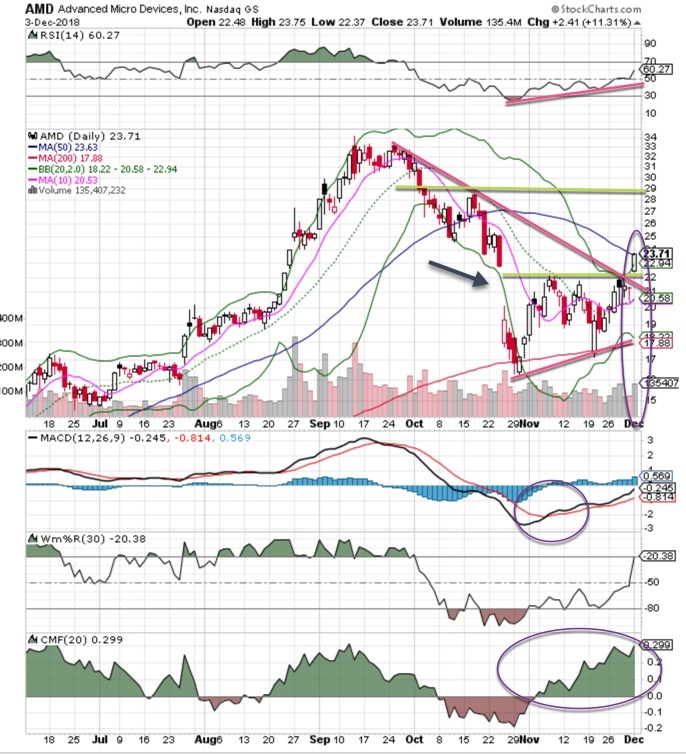
Advanced Micro Devices (AMD) has been around for years, though it’s often overshadowed by Intel and NVIDIA. The stock was on fire over the summer but faded hard into the fall amid some tech weakness. In late October, it tested that 200 ma following a strong correction of nearly 50% off those fall highs.
The chart is looking much better this week. Its resurgence is backed by price and volume and supported by other technical indicators. Note the strong Chaikin money flow, which is higher than it was back in September. That is a positive divergence. The RSI is showing a steep slope, and Monday’s epic breakout on high volume was a classic move.
I’d like to see some followthrough here, but there is potential for this stock to hit the 28+ level over the next few weeks.

Take a deeper dive into the chart action of Advanced Micro Devices on NYSE: AMD and learn how to read the technicals. Get Bob Lang’s full analysis as he marks up our chart of the week.
Love what you’re learning in our market analysis? Don’t miss a single video! Get the latest chart action delivered directly to your inbox every week as Bob breaks down stocks to watch and potential trade options!
About Advanced Micro Devices (AMD)
Advanced Micro Devices, Inc. operates as a semiconductor company worldwide. It operates in two segments: Computing and Graphics; and Enterprise, Embedded and Semi-Custom. It was founded in 1969 and is headquartered in Santa Clara, California.


