I’ve heard lots of chatter recently about an arcane indicator called the skew index, which has risen sharply. People seem to be focused on the consequences of a high skew level without taking into consideration the cause(s). I’ve written about the topic several times over the past 10 years, so let’s review the index and avoid even more confusion.
What is the skew index?
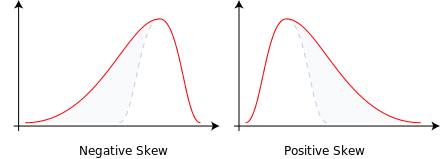
The skew index measures risk in the markets, much like the VIX. If you don’t mind me getting technical for a moment: The index specifically looks at tail-risk, a change in the price of a stock that puts it far outside the standard bell curve (you can see this in the illustrations below). As you might guess, the probability of a price change at one extreme or another is pretty low – 5% or less, as it’s two standard deviations away from the norm (thank you high school statistics).
What does it mean for us as options traders?
When trades are all lined looking for the markets to get either massacred (negative skew) or take off like a rocket ship (positive skew), it tells us a lot about trader expectations and money flow. This is meaningful data, making the skew index a great tool in your technical toolbox.
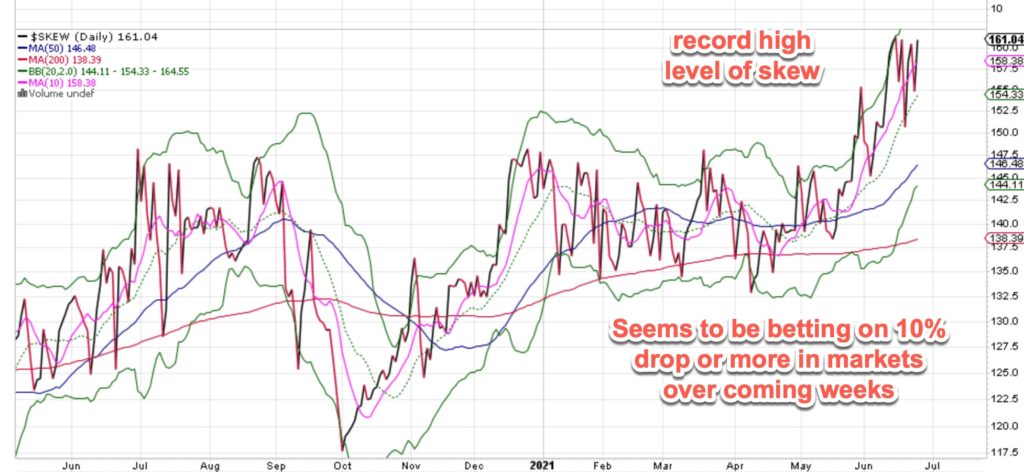
Right now, a lot of traders are making heavy bets against the market. This has been reflected in record high skew levels for options (see below).
Like I said above, the probability of these bearish trades coming to fruition is super low. How many times have traders predicted the end of the world? (I don’t know if I can count that high!) However, in a situation like this, taking the other side of the bet (a bullish one) often pays off handsomely. As you know, I am a contrarian trader. This type of trading opportunity was tailor-made for me, and I’ll be acting accordingly.


