Last week was an interesting one in the stock market, with plenty of fear and greed to go around. Excessive greed pushed Amazon, Google, and most indices to new highs. Fear led to some sharp sell offs. Surprised? Not really. By analyzing chart patterns, you can clearly see the human emotions and behavior that parallel price action.
Don’t mistake the predictability of human behavior for predictability in market action. There’s no such thing. Anyone who has ever tried to predict market action has seen his share of losses. Even though the longer term trend has been higher, the moves lower have been steep and quick, and they are painful no matter what.
Analyzing chart patterns
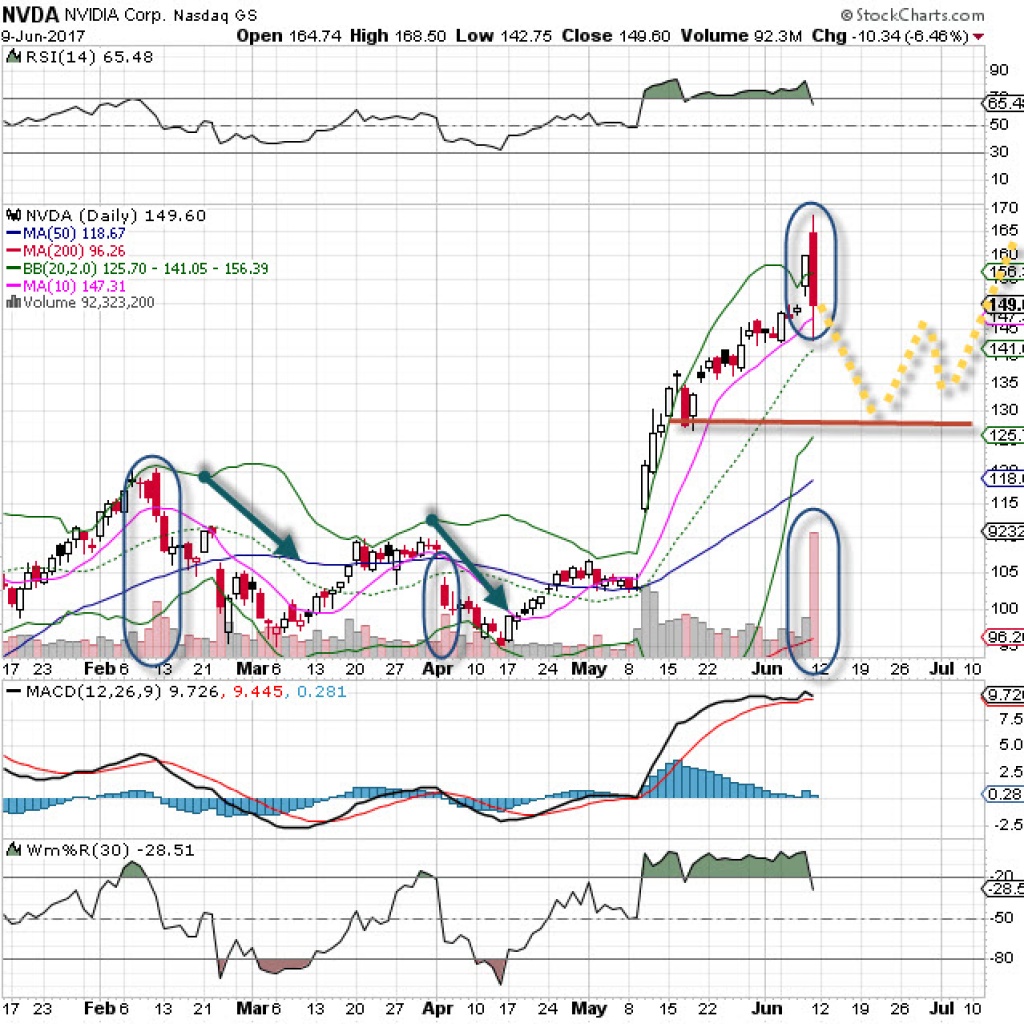
Let’s study the chart of recent high flyer NVIDIA. This stock was the top mover in the SPX 500 last year, up a stunning 300%. Many traders believed those days were behind it and expected the stock would move sideways for a while. In other words, they were predicting market action. Instead, the stock hit new all time highs last week and pushed much higher than anyone anticipated. (The last big move in May – from the 102 area up to 167 – was beyond stunning.)
As you can see from the daily chart below, the stock did indeed go down a few times. NVIDIA encountered two nasty selling days on heavy volume. There was followthrough to the downside and then sharp moves to the upside. Those trying to catch a falling knife suffered losses by not waiting for the selling to subside.
Based on those previous patterns, we could well see the same thing play out again (note my yellow W chart pattern to the right). You can see the setup for more downside first before the stock (maybe) heads back up.
Now let’s talk about greed’s flip side – fear. Look at the poor action on June 9. Fear was clearly evident in the extreme selling and massive turnover that day. Higher price levels were rejected, and when that happened the floodgates opened and sellers hit the bid very easily. This follows the pattern of behavior of sellers in previous price breaks, so the current odds favor more downside.
Again, we are not going to predict market action, but based on human behavior, we may have an idea of what will happen next. I don’t know the exact pattern the stock may follow, but I can discern from the chart where support lies (at the recent breakout level, around 130). Buyers were aggressive at this level. It is about 15% lower than the close last Friday, and but it’s an area of interest IF price stops declining.
Bottom line: By analyzing chart patterns, you can key in on areas of interest that indicate where human behavior (fear and greed) take over.
Copyright: gyddik / 123RF Stock Photo


