Examining the technical condition of the Coinbase chart made it clear there was opportunity to short the stock. Here’s a look at two bearish trade ideas in Coinbase.
In case you mostly ignore crypto, Coinbase ($COIN) is a crypto currency exchange founded in 2012. It has grown to become the largest crypto exchange (by buying/selling volume) in the world. The company is considered profitable, though its earnings are volatile due to the crypto market’s fluctuating transaction volume.
In late 2025, Coinbase came under pressure when selling intensified for Bitcoin and other cryptocurrencies. Bitcoin fell 30%, but Coinbase got hammered with an steeper move down of 64%. Things stabilized a bit, but in 2026 the name remains down 37%.
Here’s a look at two bearish trade ideas in Coinbase
Even if you didn’t know what Coinbase was, analyzing the chart from a technical perspective made it clear you had two trade options:
- Short the stock
- If you held the stock, buy put options AND sell calls against the name
Here’s how I found these trade ideas:
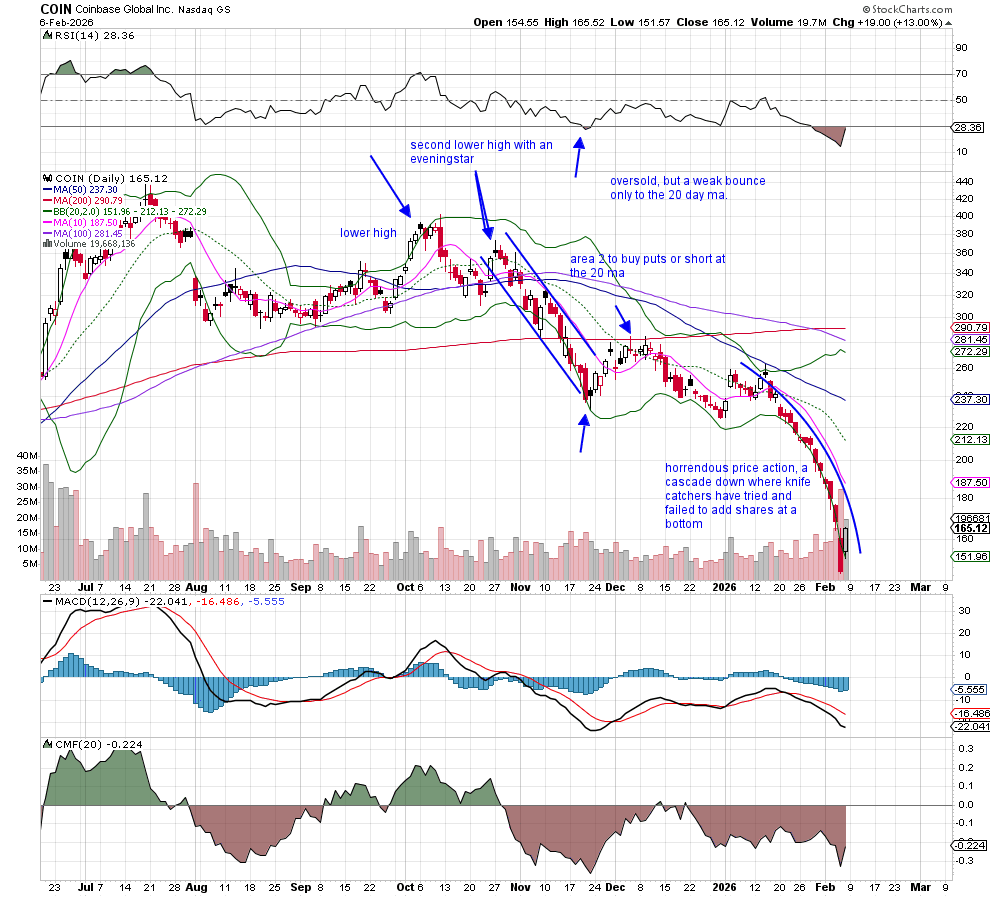
Note the breakdown in early October, which confirmed a lower high from the all-time highs in July. That was a yellow flag alert in case the name printed another lower high.
A bearish trend start forming in October
Two weeks later, that’s what happened. After making that first lower high, Coinbase moved below the 50 day moving average. At this point (first arrow from the left), the stock was starting a bearish downtrend channel looking for lower prices.
Where was your entry point?
You could have placed a short or put play after Coinbase failed to make the higher high (second arrow). The eveningstar pattern confirmed the bearish trend. In late November, the name was dropping day after day while the indices were rising.
At the end of November, it hit an oversold reading, which opened the door to a brief rally and another opportunity to short or buy puts. Look at the RSI in the top pane. This rebound rally did not push the RSI above 50. Meanwhile, the money flow (bottom pane) had not been green since October.
So, when the name rallied to the 200 day moving average (arrow in the middle), you could have jumped in to buy puts. Coinbase failed to rise above this resistance level twice, and big money has been selling the name every since.
Trade entry points are nonexistent now
More recently, you can see an oversold bounce to the declining 20 day moving average, currently at $212. This would be a nice move up from current levels, but the stock is more likely to fall short of that target and then fall back. Sellers are waiting in the wings for a chance to dump the stock on a rally.
It is not often that a chart’s moves play out so clearly. For a look at the name in bullish territory, check out this chart analysis in Coinbase from 2024.
Once you learn to recognize patterns, you can find winning trades up or down.