Is the bond market rally coming to an end? I don’t think so. For years we have heard “the end is nigh,” yet “an end” has not materialized.
Besides, bond investors and traders hate one thing and one thing only – inflation. During this 35 year bond bull market, inflation has been contained, showing up as only modest blips on the screen. The Fed has used monetary policy to keep inflation in check, because the bond market is far bigger than the equity market, and even a tiny ripple is felt by everyone.
Inflation translates into price action when it comes to the bonds, and that’s what matters most. For years, the long term trend of price has been up and the yields have been down. Recently, bonds sold off sharply, with yields rising since the end of April.
The first shock occurred after the 10 year bond dropped down to near 1.6%. Of course, everyone panicked.
“The economy is so bad that the best investment is a bond!” Now the yield is back up to near 2.2%, and investors are nervous again. 
A weak bond market may or may not be good for equities. Yields and stocks have risen in tandem, and the opposite has occurred, too. The correlation between bonds and stocks is not that strong; much of it depends on where we are in the business cycle and what kind of inflation expectations we have. No matter what, the Fed will use data to determine their policy view.
One thing I learned about bond traders back in my days as a pension fund manager is that bond investors are a paranoid and nervous bunch. They have predicted seven of the last two recessions. Paranoid, indeed!
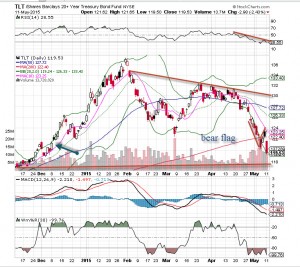
The chart of the TLT (20 year treasury long bond proxy) shows the sharp downtrend that developed after falling past 130. You can see that price accelerated downward toward a 120 support level and filled December’s open gap. Yet even with this recent bottom, there is no proof the selling has finished; we see a nice bear flag setting up. With some follow through to the downside, we could see this start heading toward support levels in the 112 area.
20 Year Treasury Bonds Chart Analysis
Take a deeper dive into the chart action and learn how to read the technicals as I walk you through the 20 yr treasury bonds (NYSE: TLT) and my analysis as I mark up our chart of the week.
Love what you’re learning in our market analysis? Don’t miss a single video! Get the latest chart action delivered directly to your inbox every week as Bob breaks down stocks to watch and potential trade options!


