As the market endured heavy selling on Monday, bonds provided a safe haven. They were bid on most of the day, though there was some selling towards the end of the session and yields fell a bit (the 10-year yield closed at the lowest level in a month).
Many investors have been concerned about a higher supply of bonds coming on line, yet when equities see concentrated selling, it’s no wonder money flees for bonds.
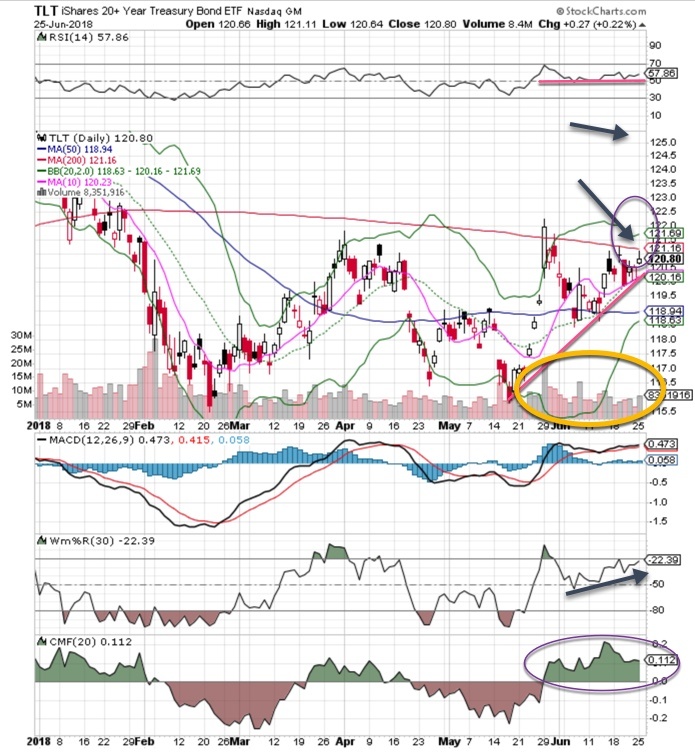
The TLT chart shows a modest uptrend but stopped firmly at the 200 ma. Notice the heavy money flow into bonds and strong momentum indicators. A move above 200 ma would put more pressure on yields.
20 Year Bond ETF (NYSE: TLT) Video Chart Analysis
Take a deeper dive into the chart action on NYSE: TLT and learn how to read the technicals. Get Bob Lang’s full analysis as he marks up our chart of the week.
Love what you’re learning in our market analysis? Don’t miss a single video! Get the latest chart action delivered directly to your inbox every week as Bob breaks down stocks to watch and potential trade options!
About 20 year Bond ETF
The investment seeks to track the investment results of the ICE U.S. Treasury 20+ Year Bond Index (the “underlying index”). The fund generally invests at least 90% of its assets in the bonds of the underlying index and at least 95% of its assets in U.S. government bonds. The underlying index measures the performance of public obligations of the U.S. Treasury that have a remaining maturity greater than twenty years.


