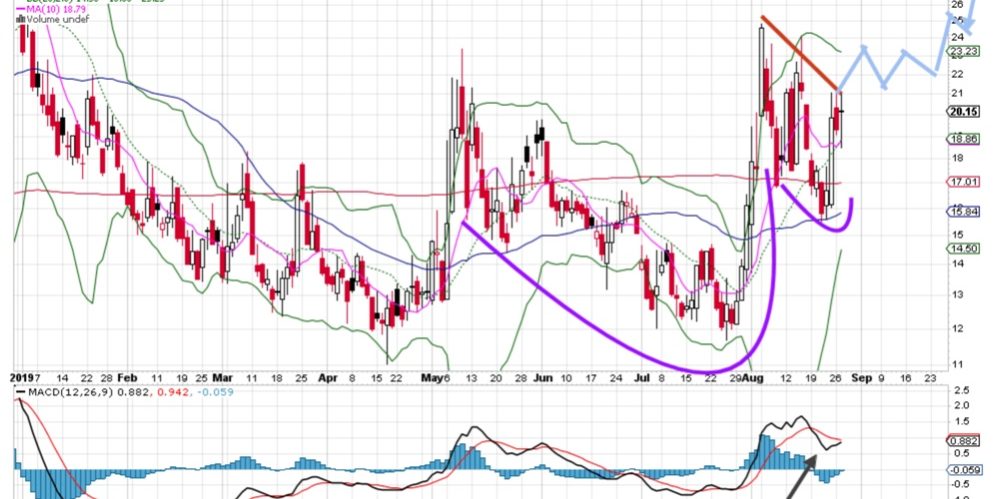
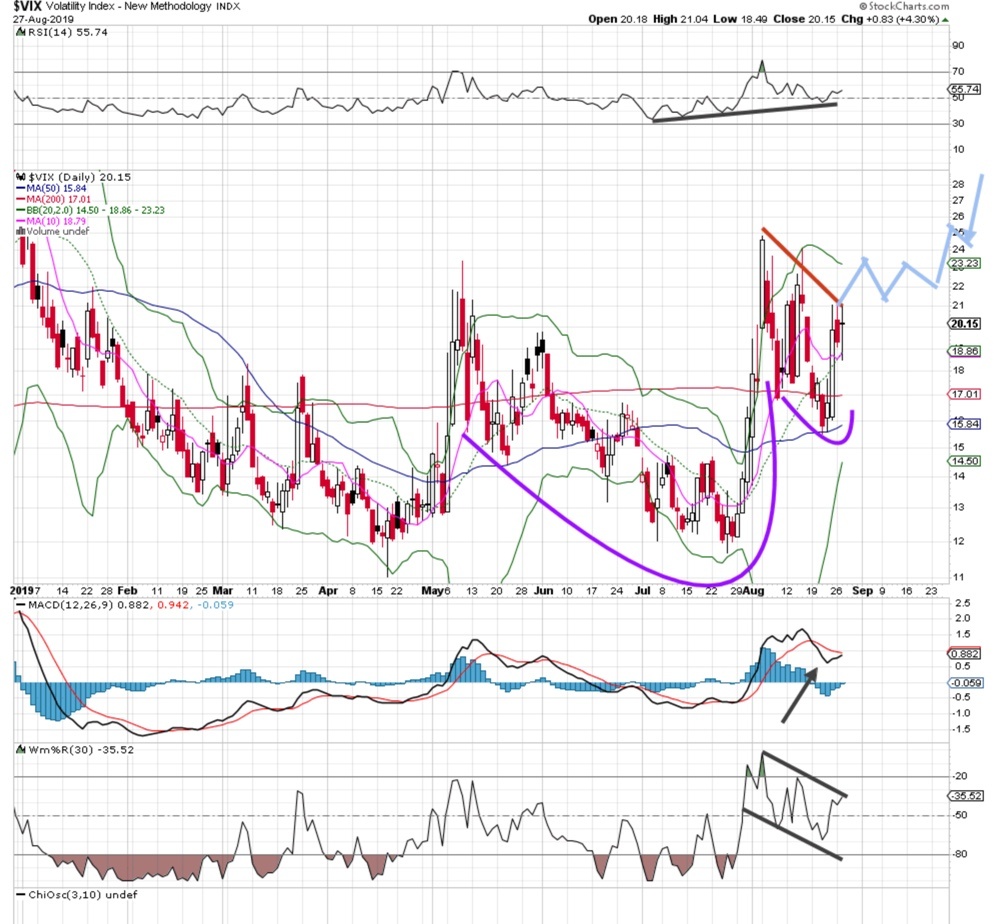
We have profiled volatility a few times recently. The shape and formation of the chart has morphed into something of a bullish trend for volatility, and that may be bad for stocks. For nearly the entire month of August the VIX has been elevated. All that means simply is big moves are happening. Most are risk averse and do not like the big moves, so selling often ensues and we see big down moves associated with the higher levels of volatility.
The chart shows a bullish cup/handle pattern, which could see this index rise substantially over the coming days. There are often spikes with the VIX though, short-lived but sharp. The MACD is about to cross for a bull signal, the RSI is steep and upward sloping. A big move above 25 would not surprise us.


