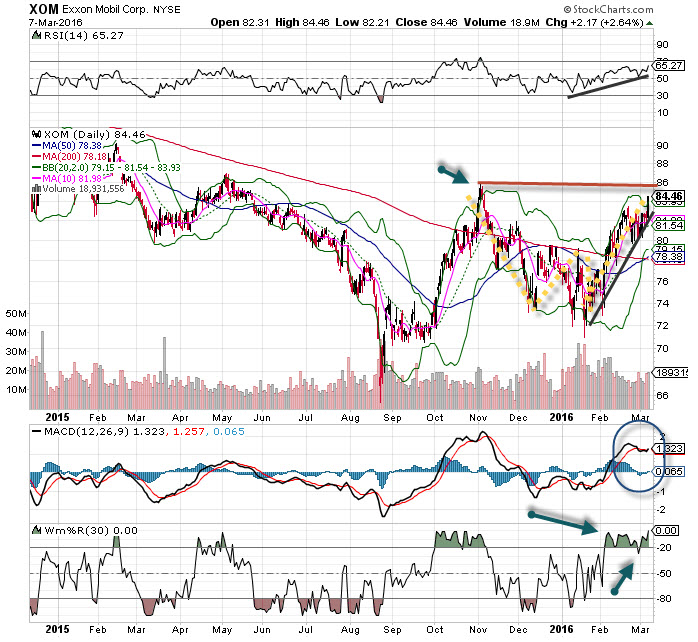
Exxon Mobil is the world’s largest oil company. When oil started to decline sharply in 2014, no stock was left untouched, but Exxon’s diversification and robust balance sheet has helped it weather the storm. Size has its advantages, and while the stock is well off all time highs, there is some fuel left in its tank here. Crude may have bottomed out as it starts to head upward, and that means higher prices ahead for the biggest and strongest companies in the energy sector. Count Exxon Mobil in that group.
The chart shows a nice W pattern with very strong turnover in February – institutional buyers are coming back to this name. The higher low in January versus the low in August signals a bullish trend. There is overhead resistance at 86, but the MACD and momentum indicators are bullish. The slope of the RS is quite impressive as well. We could see this move back to 100 very easily, even if crude rises slowly.
Exxon Mobil (NYSE: XOM) Video Chart Analysis
Take a deeper dive into the chart action on NYSE: XOM and learn how to read the technicals and analysis as Bob Lang marks up our chart of the week.
Love what you’re learning in our market analysis? Don’t miss a single video! Get the latest chart action delivered directly to your inbox every week as Bob breaks down stocks to watch and potential trade options!
About XOM
Exxon Mobil Corporation explores for and produces crude oil and natural gas in the United States, Canada/South America, Europe, Africa, Asia, and Australia/Oceania. It also manufactures and markets commodity petrochemicals, including olefins, aromatics, polyethylene and polypropylene plastics, and specialty products; and transports and sells crude oil, natural gas, and petroleum products. As of December 31, 2015, the company had approximately 35,909 gross and 30,114 net operated wells. Exxon Mobil Corporation was founded in 1870 and is headquartered in Irving, Texas.


