




Federal Reserve reports are released on a monthly basis, and they are powerful enough to move markets and thus affect our trading strategy.
As we continue our series talking about economic data traders should pay attention to, we turn to the Federal Reserve Bank. (My previous posts covered economic data, manufacturing data, and housing market data.)
Because the Federal Reserve is tasked with setting the country’s monetary policy (raising or lowering interest rates) in order to keep inflation in check and employment robust, Fed Governor statements and district reports easily move markets.
However, not all district reports are created equal. The Federal Reserve divides the country into 12 districts, which represent a nice cross-section of the country. Each district releases data that reflect if business is expanding or contracting, how inflation is affecting decision-making, along with employment numbers, if/how weather affected the economy, and currency distribution (a lesser influence).
Federal Reserve reports I always review
Monthly district reports
Most traders pay attention to the four biggest and most influential districts; each of the reports is slightly different.
- The New York Fed’s report tracks general business conditions in the state. The index fluctuates enough from month to month that I prefer to look at the data smoothed out over a three to six month moving average.
- The Philadelphia Fed’s index is a monthly manufacturing and non-manufacturing report that includes changes in pricing, effects of inflation, and and overall economic assessment across the region.
- The Richmond Fed conducts a monthly survey of business activity that covers manufacturing, retail, and services across Maryland, Virginia, the Carolinas, Washington, DC, and West Virginia.
- The Chicago Fed’s report gathers regional business data, including that of small businesses.
Strong numbers from all the districts means manufacturing is growing and the country’s GDP is expanding.
The Beige Book
This Fed report is published eight times per year and covers anecdotal data (aka, surveys) on current economic conditions from key business contacts, economists, market experts, and other sources. You can learn a lot about economic momentum, inflationary pressure, and labor market health across the entire country.
(It can be a long read – last month the beige book was 56 pages long! You have to be a big fan of the Federal Reserve to make it through that document.)
The information in the Beige Book is considered soft data, but it fills in the gaps in for hard data like the GDP, which is a lagging indicator. It has been known to cause some volatility or fluctuation in the markets on occasion. Market players can get a good read on where the Federal Reserve believes interest rates should be by reading the consensus in this report.
Below is part of the National Summary for October 2026.
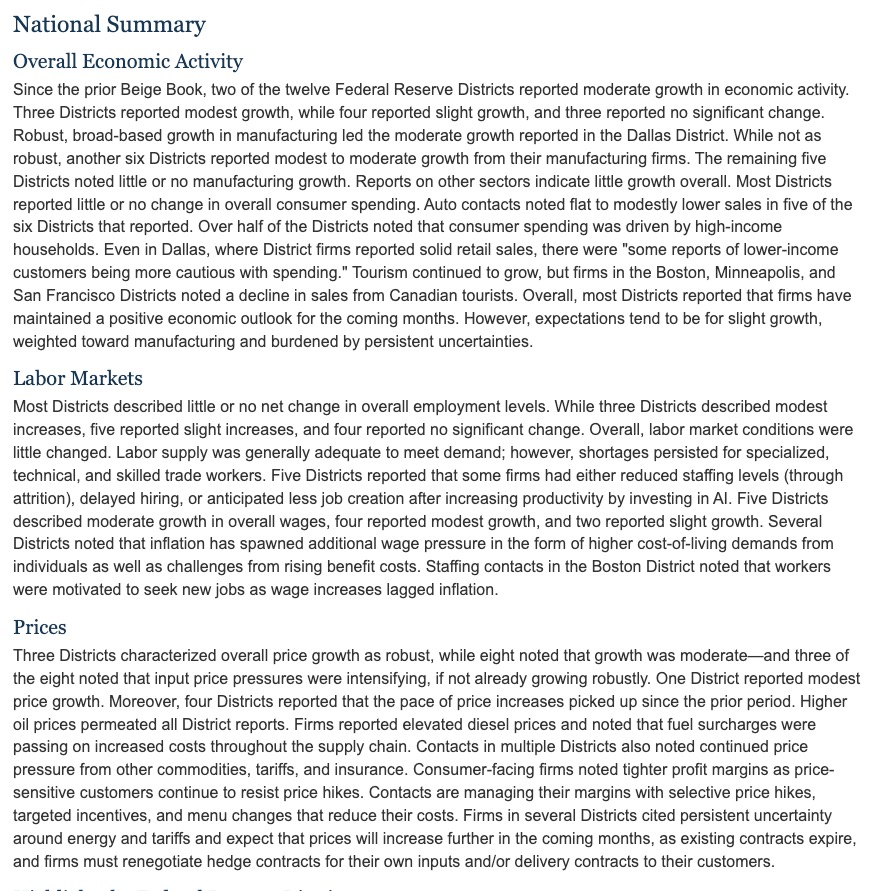
Keep in mind that all Federal Reserve reports are backward-looking and must be consumed with the current economic context in mind. For example, if the Straight of Hormuz reopened fully tomorrow, the uncertainty caused by expected increases in energy costs (as described in the above paragraph) would be moot.
While the Fed’s reports may be dull reading, they are not to be missed – at least if you want to grow or protect your trading portfolio.