It is often difficult for us to separate a good company from a good stock. Take Google (GOOG) as a prime example. As a consumer, I use Google multiple times a day – and not just for search. They have some really fantastic tools that I use all the time, too. 

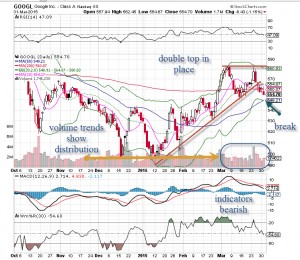
But as traders and investors, we have to look at the technicals for a good read on where the public views the stock. Everyday is an election in the market, with votes for yes or no. Currently the market is voting NO on Google. Is it unfair? That is the wrong question. We don’t have to know the why, we just have to react to what is happening in real time, without a subjective bias. We just need the facts.
The Google chart shows a double top (bearish) in place and a break of a recent uptrend line. Further, volume trends have been negative, and the indicators have rolled over bearish. There is room for more downside here, and while there are still higher lows on the chart, a close and confirm below $550 will likely push this one lower.


