By Abigail Stevenson: Jim Cramer is done worrying about a decline in retail.
“I am a big believer in skepticism, but it is possible to be too skeptical. Time and time again we have seen investors write off the American consumer … enough with the emotional rollercoaster,” the “Mad Money” host said.
Second-quarter earnings produced strong numbers for many brick-and-mortar companies, which led Cramer to believe that the consumer never went away in the first place. Shoppers just became pickier about where they shop.
While some retailers like Macy’s and Target have work to do, Cramer interpreted the broad strength of the group in the past few weeks as a good sign for the entire stock market.
He turned to Bob Lang to take a look at the retail charts to figure out where these stocks could be headed. Lang is the founder of ExplosiveOptions.net and a colleague of Cramer’s for RealMoney.com.
In Lang’s perspective, the recent strength in retail suggests that the U.S. economy could be doing better than many think.
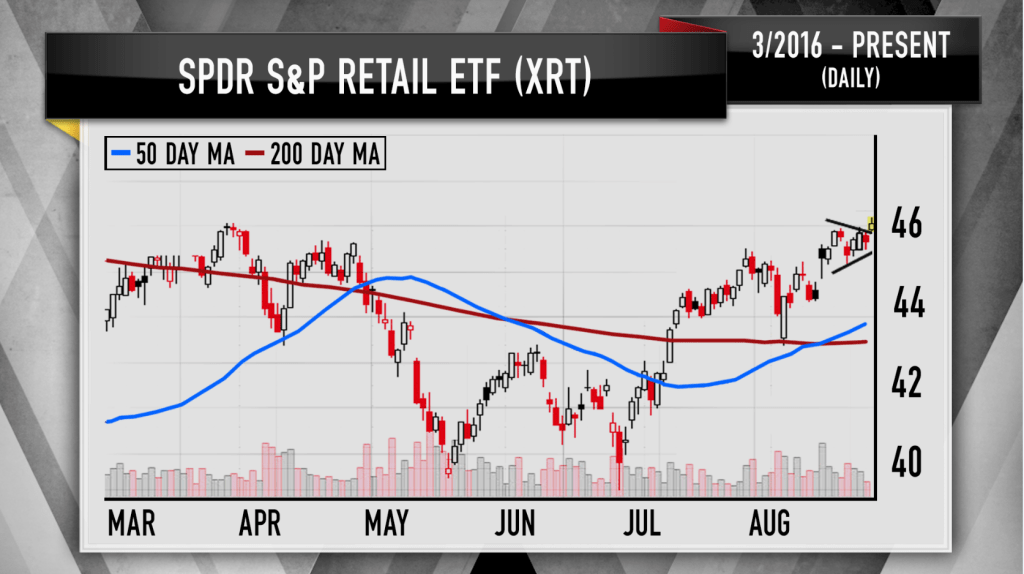
The daily chart of the SPDR S&P Retail ETF, known as the XRT, encompasses the largest retail names in the sector. Lang noted that the ETF made a W-shaped bottom pattern in May and June, which gave it a springboard to launch the recent rally.
In fact, the XRT displayed a textbook bullish pattern just two weeks ago when it made a golden cross. That is when the short-term 50-day moving average crosses above the long-term 200-day moving average. The retail ETF now trades within 10 percent of its all-time high last year. Cramer thinks it could be consolidating this week to get ready for the next leg of the rally.
“While the S&P retail ETF is useful for taking the industry’s temperature, regular viewers know that I am not a fan of sector-based ETFs,” Cramer said. “I prefer to pick best-of-breed stocks, rather than owning everything in a group.”
Two individual stocks that Cramer likes are Nike and Nordstrom.
Nike was in the doghouse back in March and managed to turn things around when it reported a strong quarter in June. Lang found that the stock’s recent move higher was on heavy volume, which suggested that big institutional money managers are once again buying it. He could easily see the stock headed to around $65.
Lang then looked at the Nordstrom daily chart, which also made a W-shaped bottom in the end of June, and has since been climbing higher. Nordstrom is now in the middle of a bullish pennant pattern, Lang said, where the stock creates a pattern that looks like a flagpole, and then trades sideways in a narrow range.
This pattern suggested to Lang that Nordstrom is digesting recent gains and could take another leg higher. While the stock is facing resistance at $54, once it breaks out of that ceiling, Lang thinks it could move into the $70s.
Even Gap, which has been in the house of pain for years, is showing bullish action. Still, even with the chart on fire, Lang expects that it could be tough for it to break through its resistance ceiling at $30.
Ultimately Lang said the charts are showing that Nike and Nordstrom could have a lot more room to run.
“You’ve got my blessing to buy both of them because they are terrific companies. But honestly, the fact that even a laggard like the Gap can be a winner in this market tells you everything you need to know about the rotation back into retail,” Cramer said.


