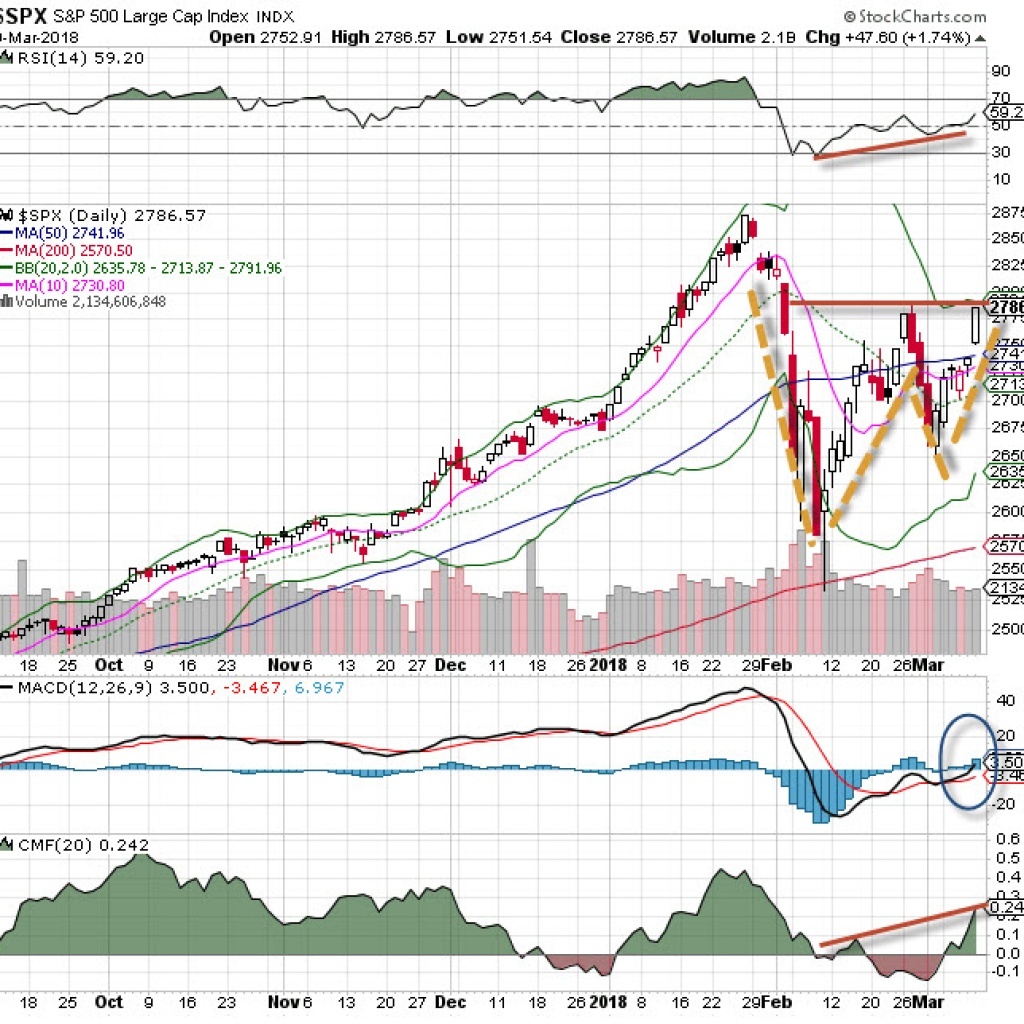
March is historically strong for the stock market, but many traders are worried that the highly volatile period of February will continue. We have seen some very choppy price movements on a daily basis, which is typical after such a heavy volatility run, but money flow is looking very strong.
Here’s what I’m seeing in the charts.
Money flow is positive
On the SPX 500 chart below, you can see that a strong “higher low” was established and confirmed on strong turnover. That tells us big institutional players are coming in to support prices, and we like to follow their lead. Plus, their support signals that this bullish market run may have some staying power.
Volatility has dropped
Volatility has come down sharply over the past couple of weeks (thought it did spike last week on tariff news). The VIX, or fear gauge, is currently at its lowest point since the February slide began. It’s sitting around 15% after reaching nearly 50% just over a month ago. It’s been quite a ride from the teen readings in January. What does this mean? The stock market has no fear whatsoever.
Other indicators point to potential movement
While several other sentiment indicators (the put/call ratio, breadth, new highs/lows) are aligned with a declining VIX, the price chart is only just showing signs of potential movement. One day does not a trend make, of course, so we’ll be looking for some follow-through. (We have a short-term overbought condition after a stunningly strong week, so there may be some wobbles early this week.)
What about the Fed?
A Fed meeting is scheduled for later in the month. There may be plenty to worry about after the meeting, but that’s just speculation. There’s no need to worry yet.
For now, take it day by day. Read the charts and indicators and follow the message of the markets.


