Chart of the Week: Nasdaq
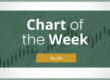
Hey good morning everybody. It’s time for our chart of the week for April 8. We’re gonna be focusing on the Nasdaq; NDAQ is the symbol. Let’s take a look at this one. Chart’s starting to look pretty good.
After a big pop lower in February, the stock fell from $101 all the way down to about $78, an almost a 30% drop. The stock’s kind of made a bit of a comeback here and just recently moved above the 50 day moving average – that was on April 7.
Two hundred day moving average, obviously some resistance there at about $90; we’re at $87 now. We could get up to $90, could see a little bit of resistance there, maybe bounce around a bit here, and then make a run up there, test that 200 day moving average, and start making higher highs and higher lows.
We think that this stock’s going to make a good strong move.
We see relative strength is just slightly broke out earlier out this week.
Good strong flow on on-balance volume.
We see MACD is also on a buy signal as well.
And volume trends are starting to pick up as well. So take a look at the some of the volume here in the month of March. Early April, not so much. But certainly in March we had some good volume. We saw the stock was chopping around over here. You see some people getting in and out of the name. But certainly in March we saw some good volume
So I think at least getting back to some resistance levels from late 2025 – $94-96 from the October highs from 2025. And then of course right up about $97 here is going to meet much stiffer resistance from back in September.
This stock I think has got some legs to get right back to that $100 level, so we’re talking about a 20% return from current levels, which would be really nice.
It’s going to take a little while to get up there, but this is a positive stock and a positive chart in a market environment that is not offering too many opportunities to go to the upside.
So that’s the Nasdaq; NDAQ.
One quick mention here – to you, to everybody here – is don’t forget about the other free products that we have available in the service here. Let me bring that up for you here.
So we have not just the chart of the week, but we also have a whole slew of mini courses as well. Options trading books, Know Your Options, the chart of the week, which of course we’re showing you today, Daily Bites weekly newsletter, Market Blast every day. And again, the Daily Bites come out Monday and Thursday.
So go to the website, go to the options trading education from trading resources here, and you’ll see a whole slew of opportunities to get yourself smart, get yourself educated, and it’s all for a great price – it’s free.
Thanks so much for watching everyone, and I’ll see you guys next time.