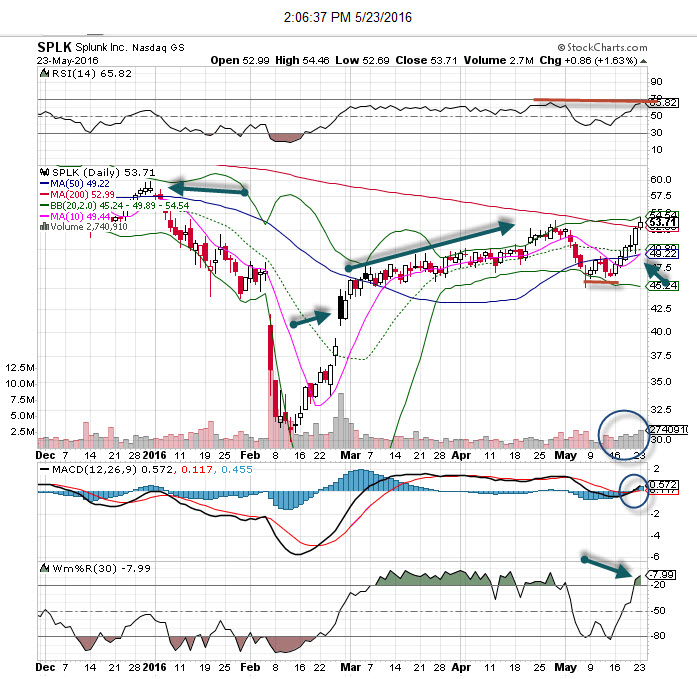
Splunk (SPLK) is an operational intelligence platform – and a highly volatile name that can provide some great profit opportunities when it’s trending. As we see from the chart below, this stock has created a wide range over just the past few months. The low in February was devastating, but SPLK got its energy back following a strong earnings report a few weeks later. That move left a big gap in the chart, and during the following weeks, we saw this stock make higher highs and higher lows in a straight line, which indicates low volatility.
Recently, Splunk pulled back to support and made a higher low on the chart. Now we see the stock trading above the 200 moving average for the first time in many months. The MACD is now on a buy signal, and volume trends have been strong. While it is overbought, we should see the stock trade back to the 50 moving average – a good stop to add the position.
Splunk (Nasdaq: SPLK) Video Chart Analysis
Take a deeper dive into the chart action on Nasdaq: SPLK and learn how to read the technicals. Get Bob Lang’s full analysis as he marks up our chart of the week.
Love what you’re learning in our market analysis? Don’t miss a single video! Get the latest chart action delivered directly to your inbox every week as Bob breaks down stocks to watch and potential trade options!
About Splunk
Splunk Inc. provides software solutions that enable organizations to gain real-time operational intelligence in the United States and internationally. The companys products enable users to collect, index, search, explore, monitor, and analyze data regardless of format or source. It offers Splunk Enterprise, a machine data platform with collection, indexing, search, reporting, analysis, alerting, monitoring, and data management capabilities; and Splunk Cloud service. The company also provides Splunk Light, which offers log search and analysis for small IT environments; and Hunk, analytics software, for exploring, analyzing, and visualizing data stored in Hadoop and Amazon S3.


