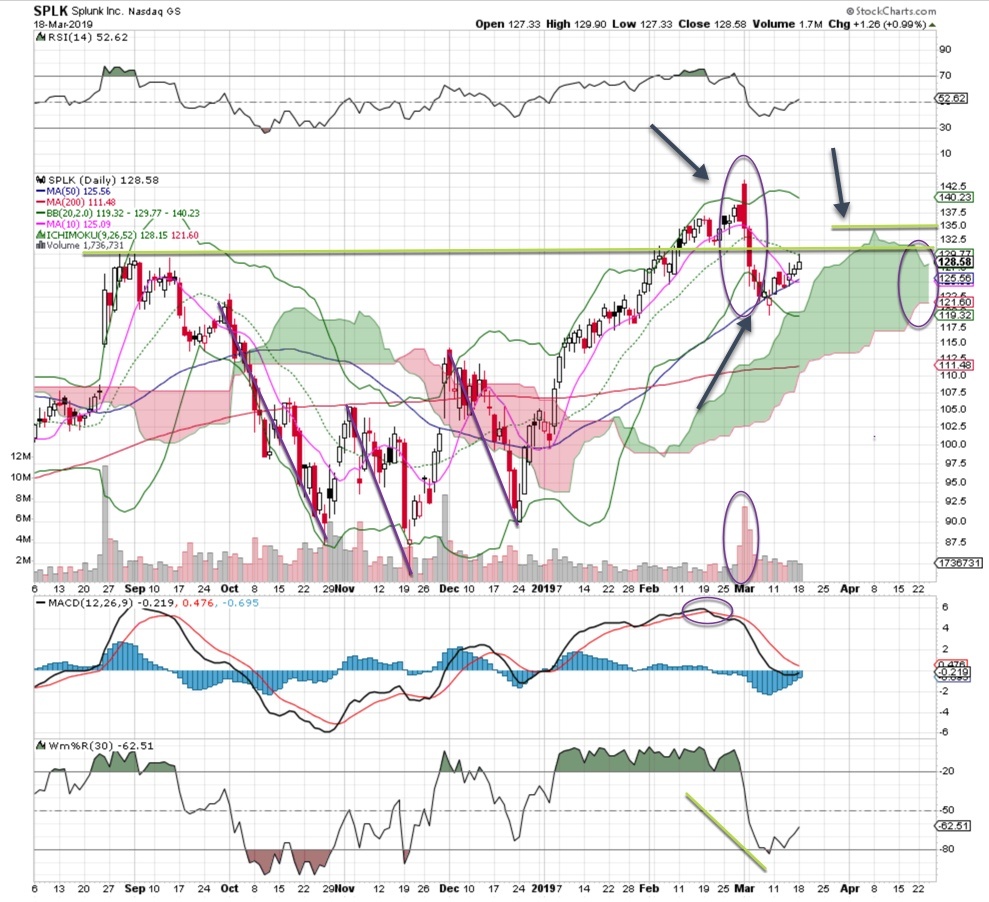
Cloud and data names have been on fire in 2019, and Splunk is one of the hottest stocks in the sector. After a garden variety correction in November and December, the stock climbed 40% this year. If you look at the chart, you will see a nice pattern of higher lows and higher highs. A bounce off the 50 ma means this name is ready for action.
Notice the heavy volume selling at the beginning of March; this small correction is played out. If you look at the MACD readings (blue lines), you’ll see similar time and price corrections in 2018. The MACD is still on a sell signal but is moving toward a crossover. I’d like to see the price lift above the cloud (around 135 or so), even though the 130 area is putting up stiff resistance. Will this recent surge send this stock through that tough area? We should find out soon.
Take a deeper dive into the chart action of Splunk stock on Nasdaq: SPLK and learn how to read the technicals. Get Bob Lang’s full analysis as he marks up our chart of the week.
Love what you’re learning in our market analysis? Don’t miss a single video! Get the latest chart action delivered directly to your inbox every week as Bob breaks down stocks to watch and potential trade options!
About Splunk (SPLK)
Splunk Inc. produces software for searching, monitoring, and analyzing machine-generated big data, via a Web-style interface. The company’s clients span sectors and include cloud and online services, education, financial services, government, healthcare/pharmaceuticals, industrials/manufacturing, media/entertainment, retail/ecommerce, technology, and telecommunications industries. Splunk was incorporated in 2003 and is headquartered in San Francisco, California.


