Israel-based Teva Pharmaceuticals (TEVA) may be over 100 years old, but its product line and price action are as spry as a newborn colt. The company has two segments, Generic Medicines and Specialty Medicines. I like Teva for its Zecuity chronic migraine treatment, Copaxone for multiple sclerosis, and its portfolio of women’s health products.
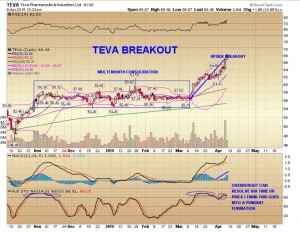
The stock spent three years forming a low base before breaking out in January 2014 and going on a stellar run, adding $20 to its share price. It then went into a stage two high base consolidation for five months, which gives another stable add-on area for a trade. The stock broke out March 9 and is looking to continue its upward momentum.
The Bollinger band complex is tilted up and to the right, which is what we like to see – charts that rise from the left to the right are solid charts. The candle today came down and tested the eight-day simple moving average (SMA), which has been a solid add point for the past two weeks. The candle also broke through the upper Bollinger band, which is another sign of strength.
In addition, the move today is on substantially increased volume. The moving average convergence divergence (MACD) indicator is stair-stepping up and the stochastics are overbought, which is the most bullish thing we can see in a stock. Often, people see a stock become overbought and immediately sell it. However, TEVA has a history of staying overbought for a week or so before going into a pennant formation that will eventually lead back into consolidation, forming another base from which to break out higher.
As this stock is in a strong sector (healthcare) and in breakout mode, I would trade this via the May 70 calls, which can be purchased for 1.05 x 1.20. As you look at this chart, please note the volume, 5,183 vs. the open interest of 39. That’s a big indicator that traders are looking for this stock to go higher.
At the time of publication, Smith was long TEVA May 70 calls $1.05 basis.


