Dow Theorists, we have a problem. The problem appears to be with the iShares Transportation Average (IYT), which is showing the beginning of a larger move on a longer time frame vs. an ending move on a shorter time frame in the transports sector.
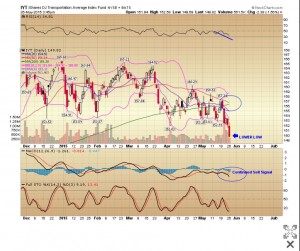
The trouble started back in March 2015 when we began to produce lower highs after making a triple top in the $165 area. This was the first warning sign.
The last attempt at breakout resulted in a selloff down to the 200-day moving average, which produced a picture-perfect bounce. However, we were faked out several days later as the IYT slipped under its 200-day moving average. It then proceeded to chop around for the next couple of weeks, sinking to a lower low in the process. This was the second warning sign.
As oversold readings were reached, the IYT rallied again, only to hit another lower high, capped by the 50-day moving average. The resistance has remained to this day, with each rally creating a lower high.
There are important developments in the short-term and long-term transport sector charts that bear heeding. The moving averages are out of order, with the eight-day below the 20-day, which is below the 200-day. Currently, we are seeing the 50-day cross down over the 200-day – this is known as the “death cross” (see the IYT daily chart, below right).
Some analysts might be tempted to call a bottom in the IYT, as the stochastics are very oversold. We may well get a bounce, but that bounce should be sold into, not bought.
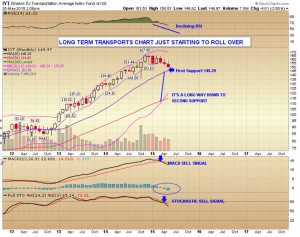
I make this decision based on the monthly chart of the IYT, which shows that we stagnated for three months at the top of the range, have a declining relative strength index (RSI), broke the eight-month exponential moving average (EMA), and have no support until the 20-week EMA, which is currently around $145.39.
We have been on a full moving average convergence/divergence (MACD) sell signal for three months. In addition, the stochastics which measure the speed or momentum of price over a designated period have just now broken the plane of overbought 80 (80 is overbought and 20 is oversold) – thus creating a sell signal and there is a long way down to the next potential real support, which is the bottom Bollinger band, or the 50-week moving average.
The other indices are going to have problems rallying without the support of the transports, although we could simply remain range- bound until conditions change. I would suggest keeping a sharp eye on the transports sector and taking selective shorts on any rally. Currently, you can get about $1.00 for the September 160/165 bear call spread.
As a final note, portfolio protection is always prudent, and you should look at it as the cost of doing business. Buying protection is not trying to “game the market.” It is meant for days when we wake up to a gap down open that only gets worse – like today. If the market rallies, your gainers will outweigh the protection, but on these down days, it will help dampen the losses and give you some time to decide a further course of action.


