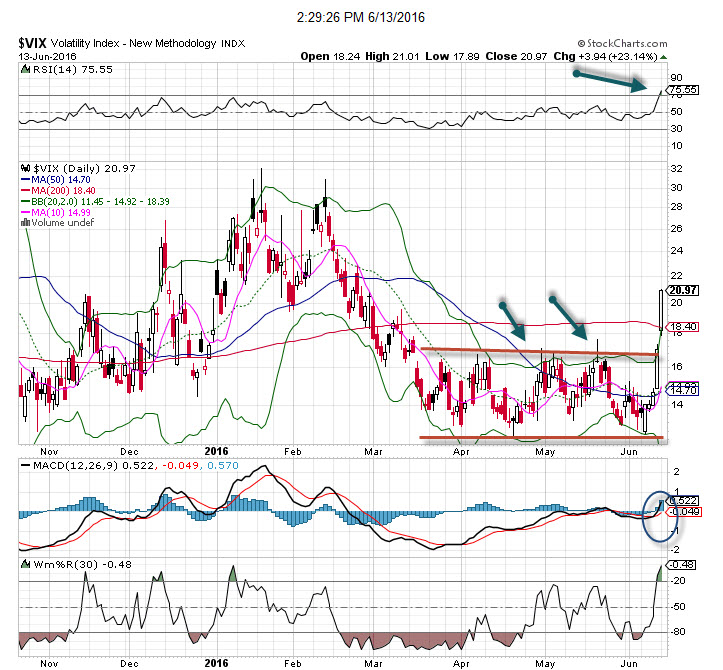
Markets are showing excessive volatility, which is why the Volatility Index, or VIX, is our chart of the week.
The markets reflected complacency over the last few months, which helped fuel a rise back up near all time highs. The Dow Industrials even closed over 18K for the first time in months last week – it was so close to all time highs. Meanwhile, the VIX was meandering in the low teens, and that had investors and traders piling into the market from the long side.
What was there to fear? The Fed is unlikely to raise rates – but they still might. And the Brexit vote was coming up quickly.
Those fears came to a head last week. Market volatility started to rise as European and then Asian markets started to crater. The pressure began to spill over to the US markets, and thus we had a major rise in volatility. The VIX really soared on Monday. It was up well over 20% on the day, closing over 20 for the first time since February.
Could this be a sign of things to come? If the news is taken badly then perhaps, but we should see the VIX decline as it has in the past. In those situations, selling volatility has been the right move – and I suspect it will be the right move this time, too.
Volatility Index (NYSE: VIX) Video Chart Analysis
Take a deeper dive into the chart action on NYSE: MOS and learn how to read the technicals. Get Bob Lang’s full analysis as he marks up our chart of the week.
Love what you’re learning in our market analysis? Don’t miss a single video! Get the latest chart action delivered directly to your inbox every week as Bob breaks down stocks to watch and potential trade options!
About Volatility Index
The VIX (CBOE volatility index) is the ticker symbol for the Chicago Board Options Exchange (CBOE) Volatility Index, which shows the market’s expectation of 30-day volatility. It is constructed using the implied volatilities of a wide range of S&P 500 index options. This volatility is meant to be forward looking and is calculated from both calls and puts. The VIX is a widely used measure of market risk and is often referred to as the “investor fear gauge.”


