If there’s one thing, and one thing only, you need to know about trading, it’s this: price is always king. Always.
As a technician, I scour indicators looking for patterns and trends that indicate the next move in price. Though nothing is perfect, patterns and trends are your best bet for accuracy (in direction); strong setups offer the highest probabilities of following through on patterns. I use momentum indicators, volatility bands, oscillators and stochastic-related tools to gain the edge I need for success, but these tools are all secondary indicators to price action.
Price is where the truth lies. There is no disputing it. You can line up all the indicators to show future direction, but if the price is not cooperating (supporting) that direction, then you have a divergence. I always defer to price (and volume) when it comes to technical analysis.
You can’t argue with price
Case in point: Recently, markets have been showing some signs that they’re ready to crack. Oscillators have broken to the downside, volatility picked up, traders are buying protection, insider selling has increased, and big funds are showing less cash on the books (aka, they’re sitting on the sidelines).
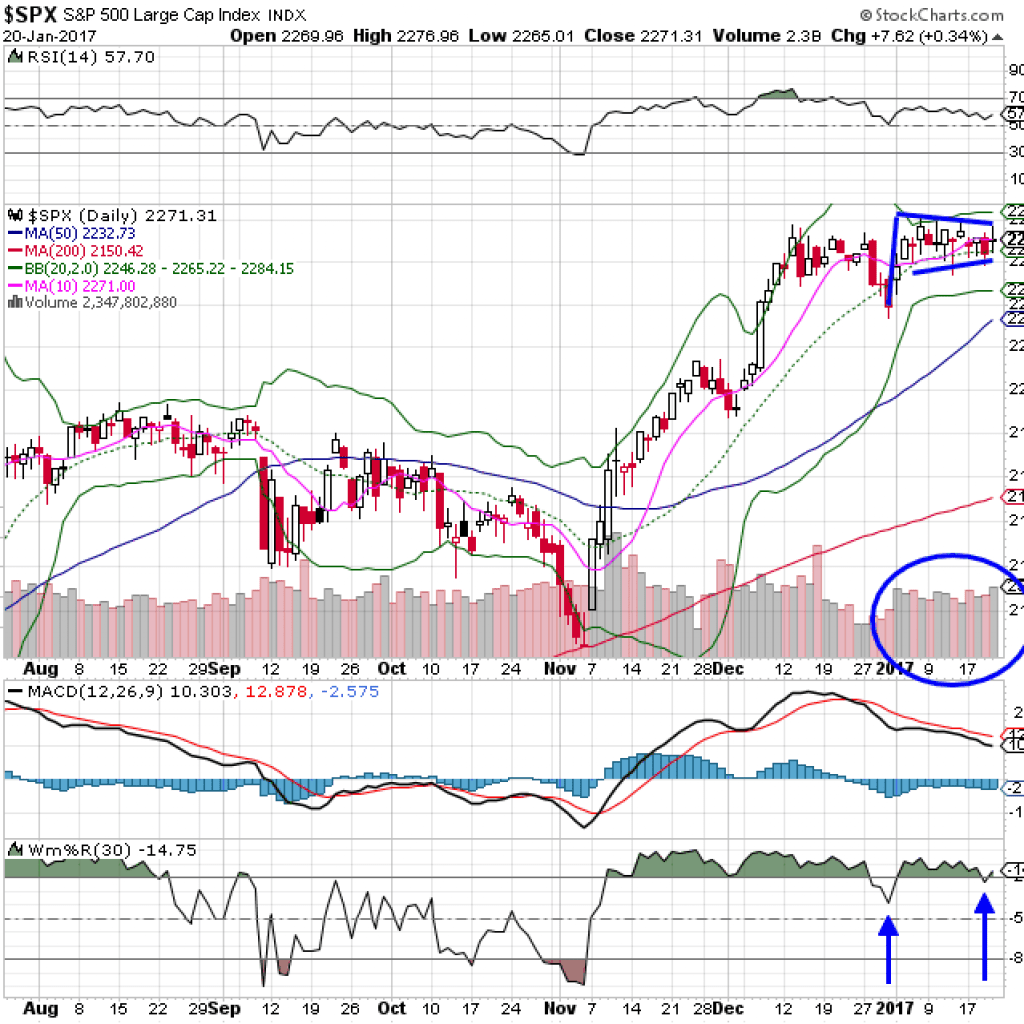
Yet, price has not broken down. In fact, the SPX 500 is range bound, bouncing between the recent low of 2233 and the all time high of 2282. That 50 point range has contained the index since a powerful up day hit in early December (see chart), seven weeks ago.
This illustrates why I look to price action first; secondary indicators often flash premature buy/sell signals. The oscillator moving from overbought to oversold may just be corrective action, so trying to follow on with a momentum trade could get ugly and trip you up in a reversal.
The bottom pane (arrows) show this happened recently. (On a side note, these were dip buying opportunities.)
Currently, price action is NOT confirming the bearish indicators. I interpret this as a market pause before the next move. Will that move be up or down? Consolidating at a high level or base tends to resolve in the direction of the trend – so that direction is UP. The current pennant formation is bullish, and the recent pullback in the momentum indicator (bottom pane) was a bull retest, which is a low-risk entry point.
If you look at trading from a “big picture” perspective, you are always looking for clues that will score you wins and avoid a major market collapse. Traders and investors whose accounts were hammered during the financial crisis in 2008-09 are still hurting. So, focus on price action. Interpret what you see to the best of your abilities and then act on it. Price never lies.
Copyright: solarseven / 123RF Stock Photo


