Rate of change (def): The speed at which a variable changes during a specified period of time.
When I am asked about advanced options trading strategies, I invariably discuss rate of change, as it can be a powerful predictor of future momentum. As we all know, it is difficult to predict a top or bottom, but from a mathematical perspective, we can use it to identify probable turning points, ride momentum, and enjoy significant gains.
Here’s how it generally works: Look for a change in trend on the chart, calculate the rate of change to help determine momentum, and estimate its trajectory.
How to spot rate of change on a chart
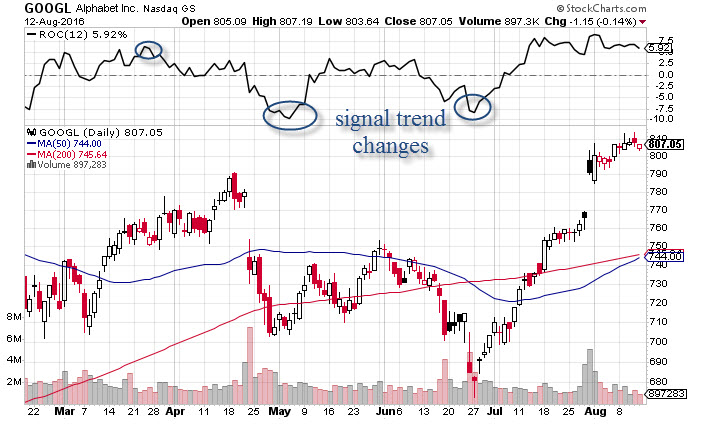
When evaluating stocks, we can use the price rate of change to identify shifts in the trend.
As we see from the chart below, it’s often a leading indicator that tells us a move is about to happen (so get on board quickly!). Like I said above, riding the rate of change can be quite profitable, but it must be confirmed by other indicators. For instance, we would like to see volume trends and oscillators moving in alignment with it. The more indicators that align, the more confidence we have.
We can also use it to evaluate other metrics, including earnings.
For example, let’s say the US economy has caused weaker earnings reports for three or four quarters in a row. There could be numerous reasons for this: higher interest rates, a stronger dollar, and weak global demand. However, if the rate of change in earnings reports is declining, the worst may be over.
Further, if company earnings start to expand, it would have a ripple effect and eventually show up in higher GDP. So basically, that inflection point could be a game changer.
While there are many different ways to analyze data, the rate of change offers us excellent insights as to when a trend change is about to happen. Pay attention to it, and confirm what you see against other indicators.
This article was updated on May 11, 2023.
Copyright: sqback / 123RF Stock Photo