I try to remain as objective as possible when trading, and one of the most reliable options trading strategies I use is looking for repeatable patterns. Price patterns track human nature and clearly show our emotions (especially fear and greed) in one spot. It is not unusual to see maximum pain or pleasure – emotional extremes – on a chart.
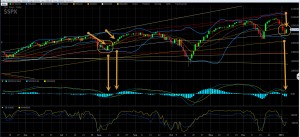
During 2014 (and now into 2015), we have been absorbed by the negative affect of falling markets, finally hitting an extreme of, “I cannot take it anymore, just get me out!” in August, which you’ll see marked on the chart below. Well, we may have hit that point again yesterday: Note the very similar patterns from late July, when the market corrected, and now.
The bounce off the 100 ma and large candle in August ignited a 90 handle SPX run to 2003 before topping out. The setup pattern is IDENTICAL for our current timeframe. Will we see that happen this time around?
If I had to force a biased decision, I could find a number of reasons why it won’t work out the same way – but that is not what chart-reading is about. I need to pay attention to the patterns and go with the signals. The less thinking I do, the better.
The challenges this market offers are endless. These frequent V-shaped patterns are dual pain points for bulls and bears alike. If you’re a fast trader, they’re great, but they’re impossible for a swing trader.
With higher volatility now (VIX came in at 19.3 but may start trending lower again), there are few reliable patterns to go on. But remember, in 2014 we saw four V-shaped rallies appear from deep oversold readings. To try and pick a bottom in these moves is foolhardy. My best approach is to watch the indicators and go with the flow.


