TL;DR: Sentiment trading indicators give you a good idea of how traders are feeling (greedy or fearful) and thus can help guide your trading.
Sentiment is simply how traders and investors are feeling about the markets, stocks, ETFs, commodities, etc. Though emotions are complex, they aren’t when it comes to trading. Traders are ruled by two basic emotions: fear and greed. How they’re feeling absolutely affects whether they are buying, selling, or sitting on the sidelines.
Sentiment trading indicators are just as important to watch as technical indicators, especially because they only align around 30% of the time. And when they do, watch out: a change in trend is probably coming.
Sentiment trading indicators to follow
Volatility Index
The volatility index, or VIX, is my favorite gauge of market sentiment. When the VIX rises, fear is on the rise. Most people are selling or considering it.
As a contrarian trader, I use this as a signal to take a position, because this indicator (like so many sentiment indicators) tells me when the crowd is leaning too heavily in one direction. If everyone is on one side of the boat, it’ll tip over. (See above – change in trend is coming!)
When the VIX is dropping, it means people are feeling complacent. They are buying – or at least, they are not selling.
The VIX is unusual in that it’s both a sentiment and technical indicator. There’s another group of indicators that cross both lines – see more below.
Put/Call Ratio
Like the VIX, the put/call ratio shows fear among traders. I like to use the put/call ratio as a contrarian indicator.
When put volume is high (bets against stocks or the market), this ratio trends higher. When puts reach parity with calls (a ratio of 1 or better), the bets on a lower market are getting heavy.
Over the long term, the average put/call ratio stands at .61, which means roughly ⅔ of all options being purchased are puts. That is a bullish ratio, which makes sense as the market trend is higher over long periods of time. However, it is in the short term that you see some opportunity to get in on the action.
When total puts/calls hit some very high readings – like a 21-day moving average over .90, which is quite rare – the odds increase for a big rally when it turns back down.
Market breadth
Market breadth is simply how many stocks are being bought versus being sold and how much volume is behind it. It does not tell you what sector, stock or index people are buying into; rather, it tells you whether money is flowing in or out of the market as a whole.
Strong breadth indicates positive sentiment and vice versa. So, like the VIX, these indicators track both trader sentiment and the technical condition of a market or chart.
The three I follow closely are the:
- McClellan Oscillator
- Chaikin Oscillator
- Arms Index (TRIN)
You can read more about them in this blog post on stock technical indicators.
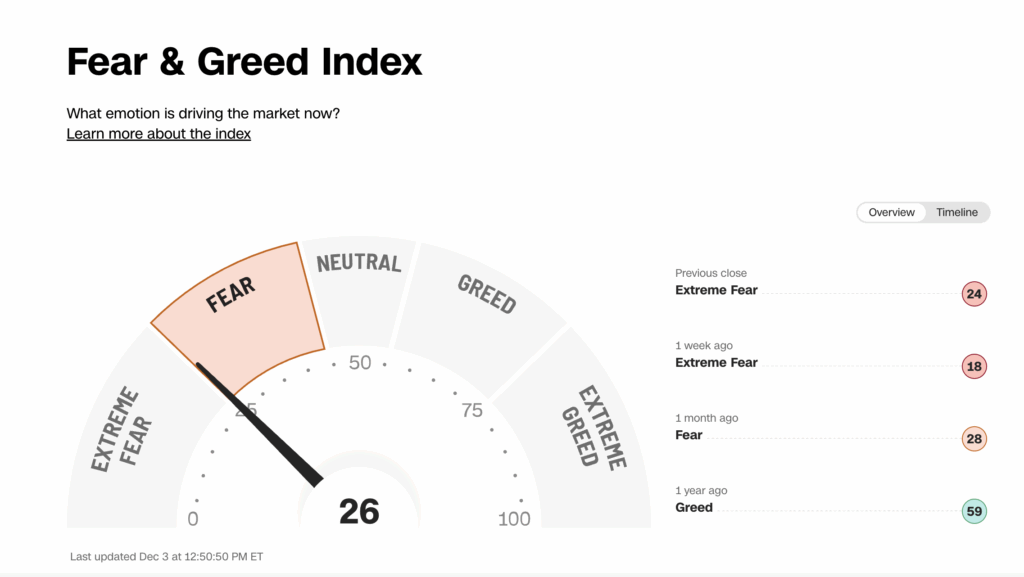
CNN Fear/Greed Index
This index provides a quick sampling of investor sentiment based on seven indicators:
- Stock price momentum
- Stock price strength
- Stock price breadth
- Put/call options ratio
- Junk bond demand
- Market volatility
- Safe haven demand
Each indicator is examined to see how far it has drifted from its average level. The results are tabulated and presented on a scale of 0-100. Lower readings indicate high levels of fear, while higher readings represent high levels of greed.
Extreme readings are not sustainable, so you can use them as a sign that the trend is going to change direction. When the index shows a reading under 20, I use it as a sign to buy.
Conversely, a reading above 80 on the index shows high levels of complacency and too much bullishness. I use this as a sign to cut positions or short stocks/indices.
Here’s what it looked like on December 3:
Investor Polls
Polls show current sentiment and should only be used as secondary sources of information when you’re trying to understand the market’s next move.
With that said, I like the American Association of Individual Investors (AAII) polls, which measure the percentage of bearish, bullish and neutral investors. Big shifts in sentiment here tell us where money may be flowing.
The media and “experts” can also influence sentiment
The Internet and airwaves are littered with experts making bold statements about what a stock or the markets will do next. Even though they are guessing, they affect sentiment, and sentiment has a way of building momentum.
Right now, all you’re hearing about is an AI bubble with arguments in both directions (yes there is one, no there’s not).
The AI hype reminds me of the dot.com bubble in the late 1990’s and more recently, the crypto currency bubble. They never end well.
Keep in mind that hype (sentiment) can only last for so long. Once sentiment changes, the bubble will burst.
Stay disciplined, patient, and vigilant, especially when it comes to sentiment trading indicators. If you lose money because you failed to change your trading strategy, you will soon face the most difficult challenge of all – earning it back.