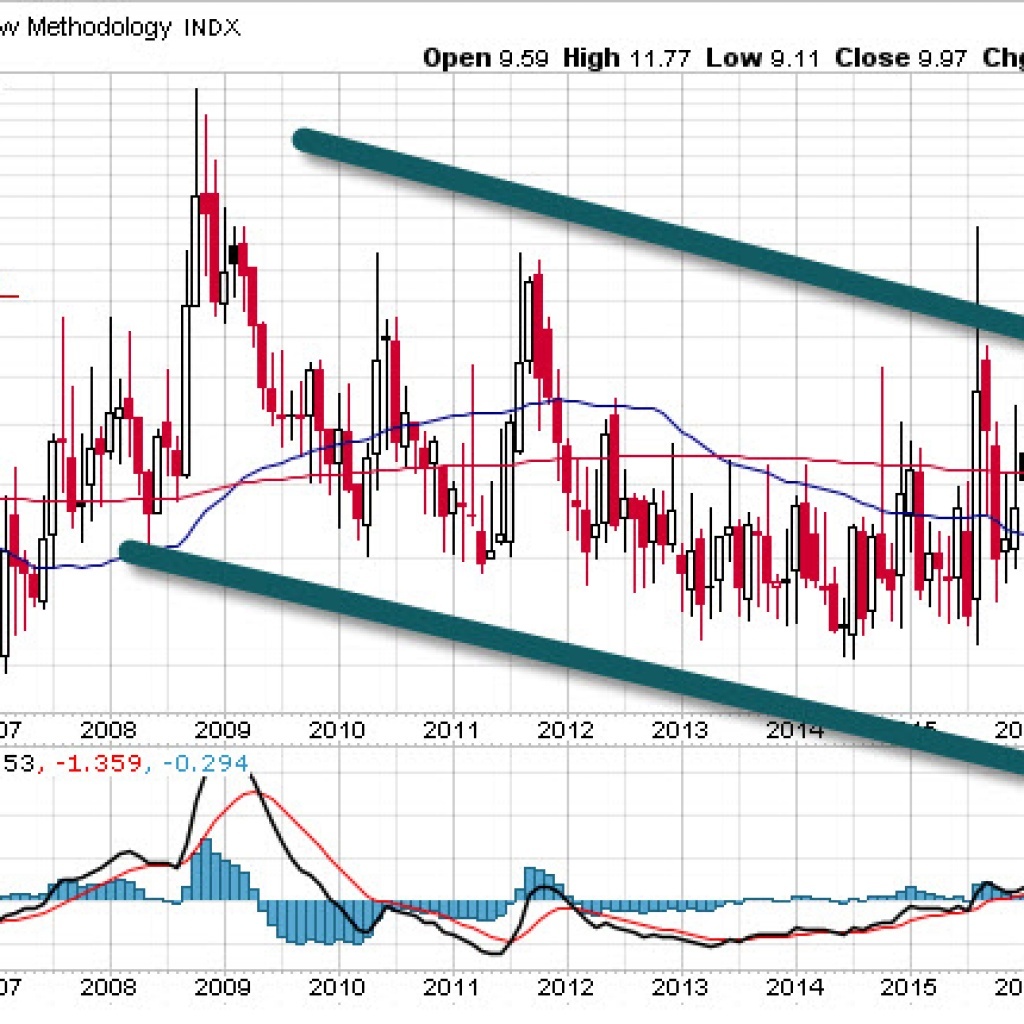
We have been in this bull market since 2009. Though we have seen our share of declines (which have been ideal buying opportunities), the long-term trend has remained the same: bullish. We know that eventually this change, and two trend indicators will give us clues.
Before we discuss those indicators, I want to remind you that we do not fight long-term trends. That’s a fool’s errand. Instead, we climb on board and look for opportunities.
VIX measures how traders are feeling
Many refer to the VIX (volatility index) as the “fear gauge”, but it is just as good at measuring greed. These two emotions rule traders, they can be very contagious and they can over-rule rational thinking.
The VIX has been in a solid downtrend from its peak in 2008 when it reached the 90’s. This indicator, which was created by Bob Whaley in the early 1990’s, had never shot up that high. (If it had existed in 1987, the famous crash would have pushed VIX to around 150).
So, what are we supposed to make of this long-term VIX trend? Too much complacency can kill a market uptrend. I have found it’s best to be a contrarian when sentiment is extreme.
Price is the key indicator, but …
Price is the key indicator to follow at all times, but it isn’t helpful when you’re trying to decipher how people are feeling. Maybe you can make some short-term gains relying on price alone, but the bulk of gains since 2009 have occurred when buying dips.
As I said above, don’t fight the trend. When the trend changes, we will have plenty of clues to guide us out of the markets or over to the bearish side. The VIX and price are two trend indicators we can turn to. Until volatility starts a new uptrend (and/or prices plummet), the markets can continue to move higher.


