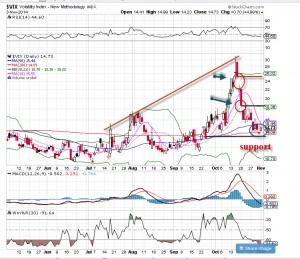
Since mid-September, the volatility index (VIX) has been on a spectacular round trip, moving up from the low teens to 31 and then turning right back down again.
Before the VIX took off to the upside on September 23, the indices were at/near all time highs. Today, we are still there, but the tone has completely shifted to shock-and-awe from complacency. Who could have foreseen a 200 handle drop in the SPX 500, only to recover it all and then some?
The chart of the VIX below shows the dramatic rise and fall when protection was being scooped up with both hands. Much like a stock, volatility moves in both directions but at a faster pace. Momentum drives the price with force; the VIX is no stranger to violent moves.
In the chart, we see unfilled gaps to the upside, which will eventually get filled (at 18.7 and just under 26). However, the downward pace of volatility is slowing (circled); I expect we could see some sideways action for a bit. The VIX term structure has also returned to normal; it is in contango again.
November starts the most bullish time for markets (this is an expected, seasonal trend), and given the backdrop of strong earnings, low rates and an accommodative Fed, we could see stocks rise without the fear of big moves (indicative of a rising VIX). That does not mean the markets are out of the clear! As we saw with the Ebola scare, it doesn’t take much for the crowd to flee the scene – QUICKLY.


