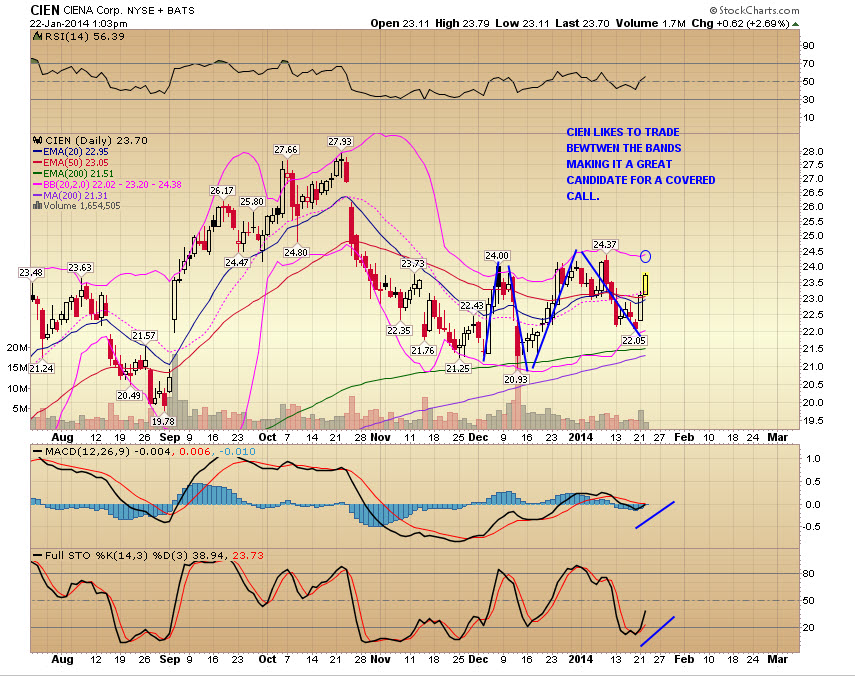
Ciena Corporation (CIEN) is a provider of communications networking equipment, software and services that support the transport, switching, aggregation and management of voice, video and data traffic. The stock recently traded down 6% to hit its bottom bollinger band, a level that has historically been supported.
As we’ve discussed, bollinger bands contain 90% of all price action, so when you look at this chart, you’ll see that the price respects the bollinger band complex and consistently trades from the bottom band to the top band and back again. This is a pattern, and patterns are actionable. Therefore, I like to employ covered call strategies on these types of charts, which I call “band traders.”
The concept is to buy the equity at the bottom band and sell calls against it when it nears the upper band. In this instance, I bought the stock at $23.10 and sold the July 22 calls against the common for a credit of $3.34 per contract. I went with in the money calls as the INTENT is to get the stock called away (another name for this is an absolute return trade).
As executed, the trade (if assigned) will provide me with a 9.7% return. It offers 14.5% downside protection, or a breakeven price of $19.76, which is well below its 200 ema and sma’s. When the stock calls away, I will keep $2.24, or $224 per contract, as profit.
If you review the history of the chart, you will see that entry at the 200 day moving averages are generally low risk, high probability trades.
To execute this trade today, you could buy the stock and sell the July 24 calls against (which is the top band area) for $2.65. In this scenario your trade offers a 12.3% return if called, 11.2% downside protection, or a breakeven price of $21.08. You would keep $2.92, or $292 per contract, as profit.
Questions? Be sure to leave yours below, and I’ll be sure to answer it!


