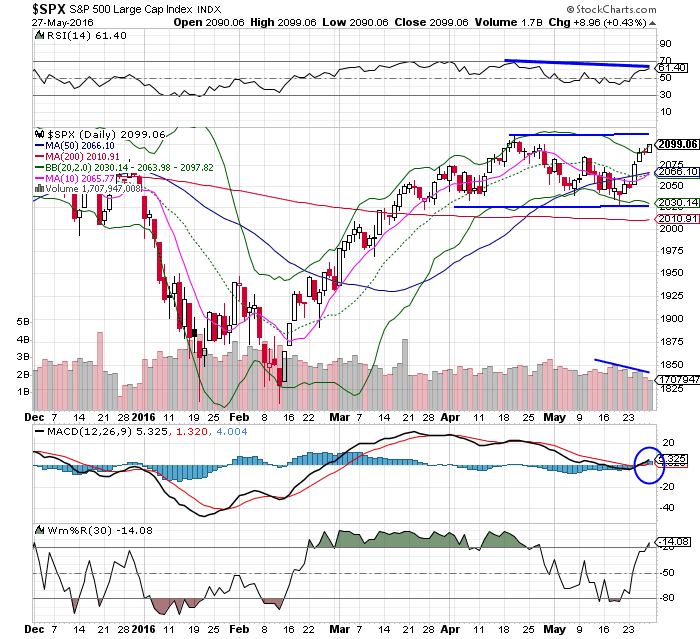
Last week, the stock market had its best performance in a couple of months. Today, people are asking, “Are markets overbought?” Based on several indicators, the answer is yes, probably. So, what’s with the mixed signals?
Let’s take a look at what is happening in the markets:
Price action is strong
Price action was very bullish last week, rising three our of five days on a very good finish the prior week. A significant support level (2040 on the SPX 500) was crossed and matched with an oversold reading on May 19 – great timing for a low to be planted.
The markets’ monthly charts look very strong and with May nearly in the books, there is probability we’ll reach a higher high. Price is right back at resistance levels from late April – around 2100 on the SPX 500. This level met failure in April and last year in both December and October.
Volume has been “eh”
Even though volume trends have not been robust on this last move higher, strong price action overrides volume. Plus, volume usually picks up when the market turns, which it did on May 19 and May 24.
Sentiment is shifting
Sentiment has started to shift as traders/investors become more confident. Yet, there are bounds and limitations to sentiment that will turn on a dime. Let’s take a look at the VIX, which closed last week near the lowest levels of the year. The last time volatility was this low was off the powerful rally in February and March when a brief correction ensued. This is a true danger sign of complacency, and while there is some economic improvement, this is not the support market players can rely on to hold up markets.
Greed is very high
But there are other concerns out there, too. The CNN fear/greed index clocked in at an “extreme greed” reading of 78, which we have not seen since March. Friday’s put/call ratio came in at 0.51, an incredibly low reading that has often been the precursor to a corrective move down. By all appearances, the “wall of worry” is being lowered – always a cautionary sign. 
Breadth looks good
Breadth was an issue from late April into May, but that correction seems to be over as breadth figures have shown marked improvement. However, the fly in the ointment may be the lack of breakouts in stocks, specifically reaching new highs. We saw far more all time highs, 52-week highs and yearly highs in late April than we’re seeing now.
For example, Apple is lower today with the SPX at 2100 than it was on April 20. No doubt some names have surged higher, and perhaps I am being a bit nit-picky here, but I do remember what happened after reaching this level in December 2014 – and so should you!
Interest rate hike is likely
Fed Governors are getting behind a rate hike that might be made as soon as June. Their goal is to make the markets “aware” that a June hike is being discussed due to a “strong” economy. (It seems their definition of a strong economy is 2% growth, so clearly expectations have been cut down significantly.)
Regardless, the markets will have a tough time moving ahead while Fed policy remains hawkish – and this could continue for years. While other central bankers continue with their money easing policies, we will see the US dollar increase in value as an offset, which will help other economies improve their data.
Are markets overbought?
Based on my technical analysis, markets are overbought. We’re not in extreme conditions, but we are standing on shaky ground. The Fed and unforeseen events can change sentiment on a dime. Don’t let complacency lull you. Pay attention and be ready to make a move when the markets tell you to.
Copyright: photobac / 123RF Stock Photo


