Market sentiment is extreme right now, which has many analysts asking when the rally will end. Your instinct may be to hit the exit before everyone else does. With so much bullishness ingrained in the markets these days, that is quite the contrarian stance.
Before you start taking trades down left and right, look at the data for clues on how to proceed. Yes, this rally has been a long one – but we are not market timers. The charts and technicals will tell you if it’s “safe” to be long or if it is time to step back.
Why market sentiment is at extreme readings
The markets have been on fire for a few months without a major correction. Since early October, the 20 day moving average on the daily chart has served as a forceful shield. The SPX 500 only closed below that line once after it filled a gap higher on October 11. That is impressive.
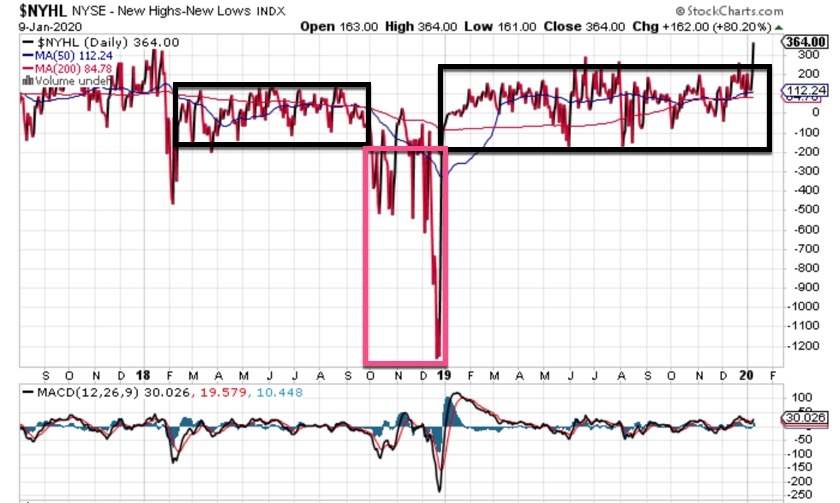
As I said above, the bulls are clearly in control here. A 12% run higher in just three months is quite the blistering (and unsustainable) pace. When does the music stop? Current breadth figures are outstanding, and new highs are crushing new lows (see the chart above).
So where is the extreme market sentiment coming from? The VIX (volatility index). It has remained rather calm, a sign of high complacency. In fact, it has not closed above 16 during the past three months.
Meanwhile, money flows into stocks have been very strong and the put/call ratio reflects unusually strong demand for call buying. No wonder we are at new highs!
The wall of worry is up high, and it may drag the most bearish of investors into the fray. At that point, we might be headed for a turn lower – but let’s wait for the market signals first. We are not there yet.


