It’s now confirmed: we are facing a market under distribution. Selling has overwhelmed buying, and prices are headed lower. As a result, the psychological effects of a bear market are weighing on many traders.
Well, we’ve been in a bear market all year! Yes, even after the huge rally off the February lows, this is still considered a bear market. And just because we’re in a bear market doesn’t mean the world is coming to an end. Some of the strongest rallies occur during bear markets, and some of the most spectacular declines have happened during bull markets. Therefore, we have to be on our toes and ready when a shift in trend happens.
You may recall the amazing 200 SPX point run in October 2014, followed by a mess of volatility and then another tremendous move a year later. Just this past March and April, we saw an incredible spring of more than 230 SPX points upward after a devastating decline during the first six weeks of 2016.
With that said, these are challenging conditions to trade in. Here’s how to trade a market under distribution:
Watch the A/D ratio
When institutions are net sellers, breadth figures slump. At this point, it’s extremely helpful to watch the advance/decline (A/D) ratio, which is one of the more important indicators of market health. A rising line detects participation and sponsorship by institutions. The publication Investor’s Business Daily grades the A/D ratio for the SPX 500, Dow Industrials and Nasdaq every day. On a scale of A-F (A being best), these indices are currently rated a D – hence a market uptrend under pressure because institutions are selling.
Here’s how A/D analysis works: A decline on higher volume than the previous day indicates distribution, while an increase on higher volume says the market is under accumulation. Now, one or two days of distribution, or institutional selling is not a big deal – markets don’t go straight up every single day. But over the long-term, you’ll see the pattern.
Look at the McClellan Oscillator
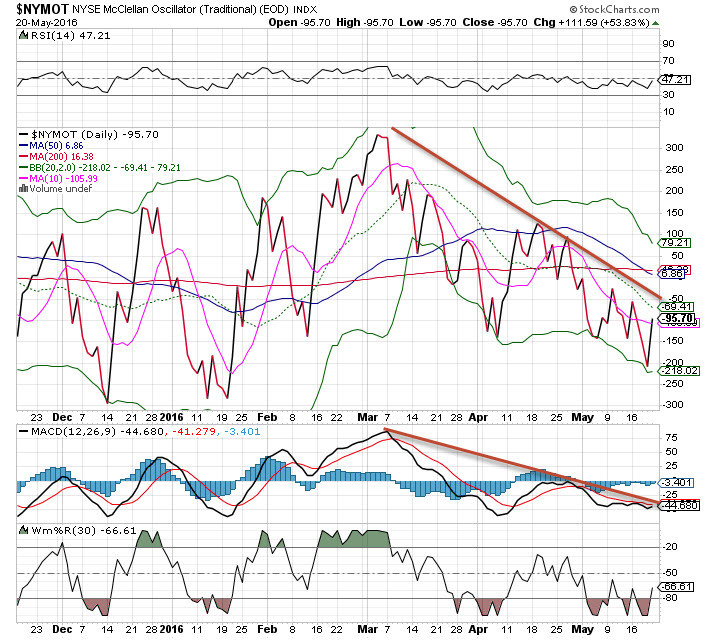
The McClellan Oscillator also gives us a good read on the market’s behavior. When it’s heading lower and hits below the zero line, it’s also a sign of market distribution. This indicator has been trending down and has been in negative for all of May. It’s also made lower highs since the start of March.
How to trade a market under distribution
All of this data can be seen each day after the close. By taking an objective and non-biased view of the data, we can determine how to proceed. When you see that institutions are selling, don’t be tempted to pick up the pieces. Instead, take advantage of the action and go with the trend.
If you’re long stocks, sell some and/or buy some protection using put options or inverse ETF’s or by shorting stocks.
Will the condition change? Sure it will – but don’t try to guess when that will happen.
Copyright: rido / 123RF Stock Photo


