As we head into earnings season for Q1 2016 and face monthly options expiration, it is a great time to do some market analysis.
Analysts have lowered the expectations bar significantly, and in many cases, companies will only have to “walk over the bar” to meet analyst numbers. The stock market reflects this discounting, so earnings reports could be the catalyst to boost the market. However, quite a bit of work will be needed to see this materialize, so don’t put on your bear hat yet. After the powerful market run that began in February, we should expect some give back.
Be cautious to ensure your portfolio doesn’t get chopped up. If we take an objective view of the technicals and keep an open mind, which my friend Chris Ciovacco reminds us daily (and weekly), then we can take what the market is willing to give us whether it moves up or down. Many have been waiting for a dip to buy into this market. This is one – and it may be at a nice spot. Look for opportunities, but don’t get ahead of yourself.
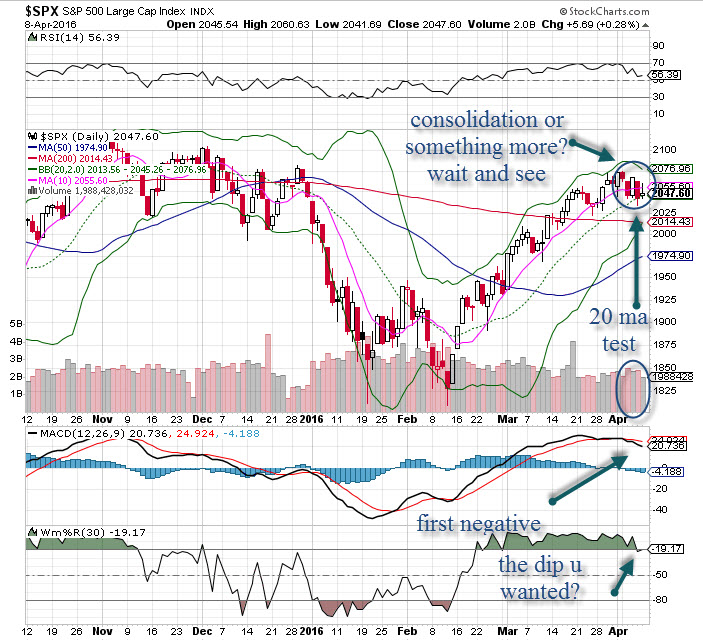
Let’s now turn our market analysis lense on the SPX, which had a couple of distribution days last week – the most we’ve seen in a five day period since the end of February. The rally, which started out from the low on February, seems to have traveled a normal course of about six weeks before stalling. We can see over the past week some fatigue in the price action. If it doesn’t improve, then we’ll see everyone hitting the exits at the same time. It’ll feel like deja vu from January.
Certainly conditions are different now than they were at the beginning of the year. Gold is strong, crude is now in an uptrend, and other commodities are following suit. The dollar is weak, and it closed last week at levels not seen since August 2015. We may see this continue as the central banks’ currency wars take center stage.
Back to the charts. The SPX 500 is best positioned to digest gains and resume an upward trend. The index is now sitting on its 20 MA, often an area of first defense following a breakout. This is not a “line in the sand” per se for the bulls, but if it fails to be re-captured over the next several days, more selling will come. We’re not calling a top here – that’s not our game. Instead, we’re following our wait and see approach, which we covered during last week’s webinar.
The indicators are somewhat mixed with some yellow alerts flashing. Breadth has broken down over the past couple weeks, but it’s too early to determine its significance. The rally in March had tremendous breadth – so good it hit an all time high (last reached in 2014). Perhaps this is just a short pause to “catch a breath.” The VIX is still relatively low, and while it stays there, stocks can continue to rise (but we can expect the short-lived smack downs to come unannounced).
Volume was elevated on Tuesday and Thursday last week, the two big sell days, and the Nasdaq now has six distribution days in its count (thanks IBD). Finally, the sentiment polls are mixed, though some are begrudgingly getting kicked into the bullish camp (and they’re going kicking and screaming).
What does my market analysis mean to you in practical terms? If you want to make it through the next few weeks, keep the noise turned down and stay focused on the charts. The market will always tell you how to proceed.
Copyright: lightwise / 123RF Stock Photo


