Random movements in the stock market are very tough to explain, but once we understand the role that sentiment plays, these moves make sense. Remember, stocks move along a spectrum marked by fear and greed, and a chart can clearly show these emotions.
Plug in several sentiment-related indicators, and you’ll be able to read the pulse of market players, which is especially useful in the short run. Sentiment tends to build up, and when it gets into extreme territory, a major turn is likely to happen.
In part 1 of this series, we’re taking a look at the Volatility Index and how it impacts decisions and market movements.
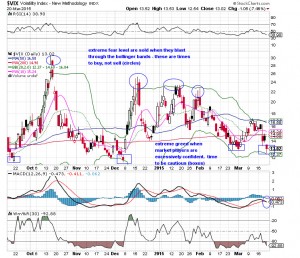
The Volatility Index (VIX) tells us where short term options players are placing their bets. The VIX rises when fear is present and drops when fear subsides. What causes the VIX to rise? Uncertainty over future events and a high level of complacency among traders and investors. On the flip side, if traders and investors become too greedy, it shows up in a very low VIX reading, much like we currently have (the VIX is at 13%, the lowest level of 2015 and the lowest since December).
What does this mean? Investors and traders are not worried about stocks going down. A contrarian thinker like me might point out that there are no buyers left at this point. With only sellers able to take action, there is little left to boost stock prices (or so the theory goes).
So, when the VIX is elevated and reaches extreme levels, we often have opportunities to buy. I know when the VIX has hit this extreme level by bracketing the daily VIX chart with bollinger bands (two standard deviations from the mean). The bands capture 95% of the price action in the VIX, but it is the moves toward and through the upper band that tell us when a reversal is about to happen. Take a look at the chart to the right.
Personally, I have really tried to simplify the usage of the VIX as a trading tool. Other traders, like Mark Sebastian and Andrew Giovinazzi from optionpit.com, take a more comprehensive view of the VIX, drilling down to the intricacies of the signals and its relationship with the markets. The term structure of futures is also an important gauge for sentiment, and Jay Wolberg of tradingvolatility.net gives us a great portrayal of these dynamics each day.
The VIX is but one indicator in your arsenal of trading tools, but probably one of the most important, since it helps you recognize if the emotions of the market are heating up or cooling down.
In part 2, we’ll take a look at how the put/call ratio can give us a leg up in predicting market movements.


