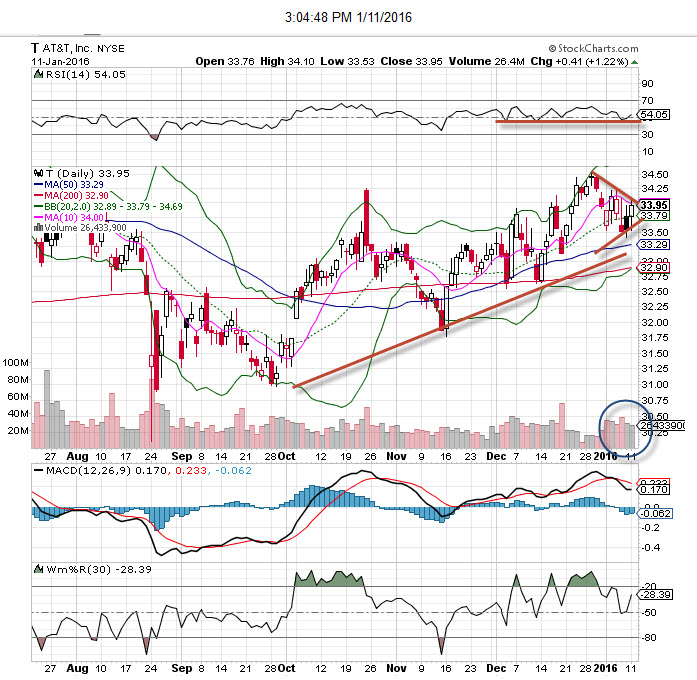
Not many stocks have escaped the brunt of selling in this new year, so it’s not easy to find a name that still has good relative strength. One exception is the old-line tech name name AT&T, which has so far escaped the intense selling – and is actually up so far this year.
Take a look at the chart below, and you’ll see a triangle that was formed at a higher base price. It seems to be pointing toward higher prices ahead. Volume has been elevated, and that may also be a good sign. Additionally, momentum indicators are turning up here, and with a higher high in the chart, we may see this forgotten stock head toward previous highs (which were achieved a few weeks ago). AT&T pays out a nice dividend for protection as well, a nice way to get paid as an alternative to fixed income.

AT&T (NYSE: T) Video Chart Analysis
Take a deeper dive into the chart action on NYSE: T and learn how to read the technicals and analysis as Bob Lang marks up our chart of the week.
Love what you’re learning in our market analysis? Don’t miss a single video! Get the latest chart action delivered directly to your inbox every week as Bob breaks down stocks to watch and potential trade options!
About AT&T
AT&T Inc. provides telecommunications services in the United States and internationally. The company operates through two segments, Wireless and Wireline. The Wireless segment offers data and voice services, including local, long-distance, and network access services, as well as roaming services to youth, family, professionals, small businesses, government, and business customers. This segment also sells various handsets, wirelessly enabled computers, and personal computer wireless data cards through its owned stores, agents, or third-party retail stores; and accessories, such as carrying cases, hands-free devices, batteries, battery chargers, and other items to consumers, as well as to agents and third-party distributors. As of December 31, 2014, it served approximately 120 million wireless subscribers.


