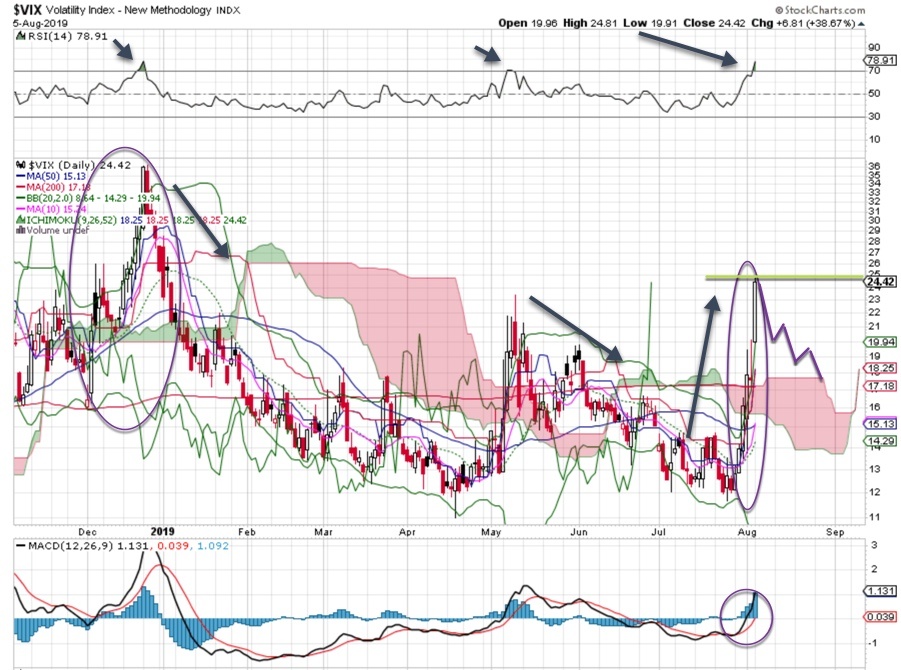
The VIX has woken up, and the bulls are not happy about it. Can’t it just take an Ambien and go back to sleep? Not with the trade and currency war ratcheted up another notch. Markets hate uncertainty. When a tweet about tariffs comes out of nowhere, the big money flees – and everyone follows them out the door.
Over the past few days, the VIX has gone up 100%. Take a look at the VIX chart below, and you will see a similar move in December 2018 and February 2019. The MACD is on a buy signal, and RSI levels indicate the VIX may be exhausted. I am waiting for a reversal before making a counter move. It’ll come – just be patient.
Take a deeper dive into VIX chart action (Nasdaq: VIX) and learn how to read the technicals.
Love Bob’s market analysis?
Join our charting service! You will learn how to analyze and interpret charts so you can make better, more successful trades with more confidence.
About VIX
The CBOE Volatility Index, known by its ticker symbol VIX, is a popular measure of the stock market’s expectation of volatility implied by S&P 500 index options. It is calculated and disseminated on a real-time basis by the Chicago Board Options Exchange (CBOE), and is commonly referred to as the fear index or the fear gauge.


