close
  • Home
  • Blog
    • Options Trading Charts
    • Options Trading Strategies
    • Stock Market Analysis
    • Options Trading Webinars
  • Trading Service
    • Compare Plans
    • Directional Options Trading
    • Spread Trading
    • Trading Chat Room
  • Trading Resources
    • Chart of the Week
    • Options Trading eBooks
      • 4 Essential Rules
      • Yes You Do Have Options
      • The Art of Selling: Options Trading eBook
      • Trading Stories from the Trenches
    • Options Insights Webinar
    • Options Trading FAQs
    • What Is Spread Trading?
    • Options Trading Glossary
  • About
    • What We Do
    • Meet Bob Lang
    • Bob Lang Live
    • Explosive Options Testimonials
    • Contact Explosive Options
  • Member Login
  •  Facebook
  •  Twitter
  •  LinkedIn
  •  Google +
  •  YouTube
Explosive Options Trading Service
  • Menu
  • Home
  • Blog
    • Options Trading Charts
    • Options Trading Strategies
    • Stock Market Analysis
    • Options Trading Webinars
  • Trading Service
    • Compare Plans
    • Directional Options Trading
    • Spread Trading
    • Trading Chat Room
  • Trading Resources
    • Chart of the Week
    • Options Trading eBooks
      • 4 Essential Rules
      • Yes You Do Have Options
      • The Art of Selling: Options Trading eBook
      • Trading Stories from the Trenches
    • Options Insights Webinar
    • Options Trading FAQs
    • What Is Spread Trading?
    • Options Trading Glossary
  • About
    • What We Do
    • Meet Bob Lang
    • Bob Lang Live
    • Explosive Options Testimonials
    • Contact Explosive Options
  • Member Login

Stock Market Analysis: Is the Bear Market Ending?

By Explosive Options,

February 4, 2019
bear market ending
January was quite a month for traders and investors! Everyone entered the month sitting on the edge of their seats to see how things would unfold. After a stellar performance, some are asking, “Is the bear market ending?”

This question would have been laughable a month ago. We entered 2019 after suffering through the worst December in 80 years. Indices dropped more than 10% (on December 24) before the biggest buying day in years ensued two days later. The SPX 500 finished 2018 with a 6.3% loss after it was higher by more than 10% just a few months early.

My how things have changed. Let’s take a look at the technicals.

Is the bear market ending?

In a reversal of fortune, the year started off strong and continued to move toward the upside. The SPX 500 finished January with a gain of nearly 8%, which is a blistering pace. We know that cannot continue, especially since we are still in a bear market. Yes, I said it. The longer term trends have not shifted enough to call off the bear label.

The monthly chart still shows the MACD crossover as bearish. This is the clue we used to form our bearish analysis back in October, and it still applies.The strong month of January offset the December losses – but it doesn’t mean we’re out of the woods. When the black line crosses above the red line (thick over the thin) then we’ll have a change in trend.

Resistance is very heavy. The 200 ma is in sight and could be tested within weeks. When that happens, market players may take a break. I find that markets move in six week cycles, so the current bullish run may end in the middle of February. A breather or even a pullback will allow traders to re-assess positions.

Some technicals look positive

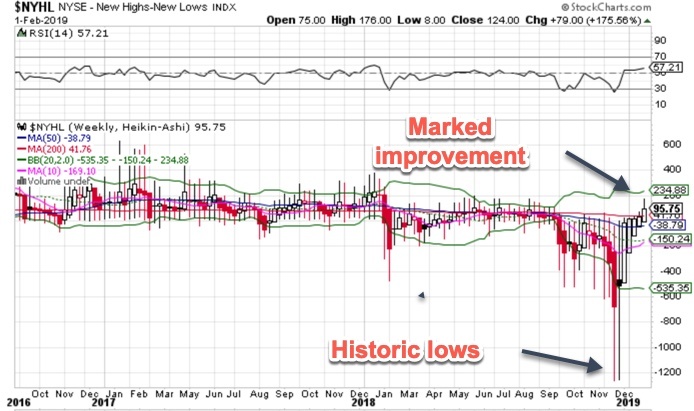
A sign of good things is the new high/new low list, which hit some off-the-chart low levels back in December. The improvement here is remarkable – see the chart below. It typically takes this indicator months to improve. Instead, this about-face occurred in only one month.

january

Another positive sign is the very weak volatility index, which closed at a multi-month low when some uncertainties (like interest rate hikes) were removed. Breadth has been outstanding, while the put/call ratio continues to sink lower. These are signs that the rally can continue, but the cautionary flags are still waving.

The stock market performance is reflected in our Explosive Options portfolio results. Things started slowly, but they ended with very strong gains for January. The EO portfolio rocketed higher by 11%, eclipsing all of the indices. This coming after a very strong 2018 where the portfolio gained more than 8%. We booked some terrific winners this month, and we will have more to harvest as the weeks go on.

  • Facebook
  • Twitter
  • Google+
  • Pinterest
  • LinkedIn

Tagged:bear marketbull marketmacdtechnicalsVIX

Post navigation

← PreviousHow to Evaluate Long-Term Market Trends
NextHome Depot Is Rebuilding a Strong Chart →

Categories

  • Options Trading Charts
  • Options Trading Strategies
  • Options Trading Webinars
  • Stock Market Analysis

Tags

aapl banks bear market bernanke bonds broker bull put spreads chart analysis chart of the week crisis debt earnings faz fear financials futures gold goog index ETFs indicators investors jim cramer Mad Money market market analysis market timing mcClellan Off the Charts option premium options options trading strategies options trading webinar psychology of trading QE risk management selling premium SPX stocks Suz Smith technicals The Fed VIX volatility volume weekly webinar

Explosive Options

  • Home
  • Options Insights Blog
  • Options Trading Service Membership Comparison
  • Options Trading Resources
  • About Explosive Options
  • Member Login
  • Privacy Policy
  • Terms of Service

Contact Us

Contact Explosive Options

© Aztec Capital LLC