


I often say there are a million reasons to sell, but only one reason to buy. Last week, it seemed that any reason to sell was a good, valid one, and boy, were the sellers out in full force. Time for a little stock market analysis to understand what’s going on.
Poor price action and anxiety fueled sellers
Friday’s ugly pasting was the culmination of a setup earlier in the week that signaled a rejection of prices was going to happen. As we see in the 15 minute chart from this past week (below), early highs were rejected on a few occasions. Furthermore, there were several fake outs during the week when it appeared there would be some followthrough buying (but no buyers materialized), further stoking the sellers.
Don’t get me wrong: There is nothing wrong with some good, old-fashioned selling. Markets don’t move straight up to the sky. They zig-zag their way up, because, as I mentioned, there are always reasons to sell. Many traders are quick to blame algorithms and high-frequency traders when price action moves into negative territory, but I don’t care who is doing it – selling is selling, period. If you’re trying to rationalize selling, that’s fine – but don’t let it affect your decision-making and judgment.
Friday’s drop is being blamed on a mess in high-yield bonds (it looks like hedge funds are having trouble with liquidity and redemptions), multi-year lows in crude (oil is now under $36 a barrel), worries over economic growth in Europe and China growth, and uncertainty over a possible change to Fed policy this week. Pick a reason for selling, but remember: Selling is selling.
Stock market analysis: SPX 500
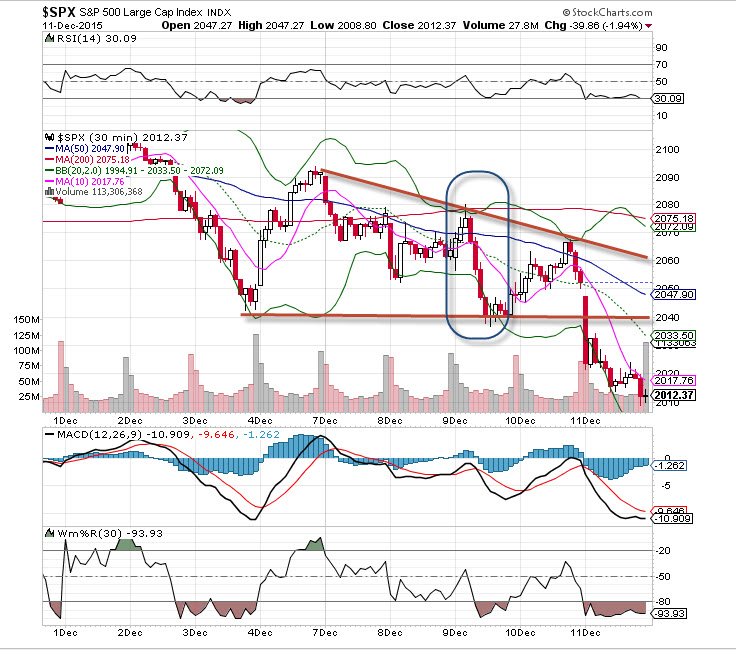
Let’s look at the SPX 500 chart for two time frames, the 30 minute chart (which highlights the action during the week) and the 15 minutes, or daily, chart.
The 15 minute chart shows some lower highs and lower lows, but what is particularly troubling was the reversal on Wednesday, December 9. The index was up well over 20 points only to drop 45 points in a straight line during the day. Some buying picked up toward the end of the session, but the damage was done. The chart shows lower highs until Friday’s massive sell-off, plus the momentum indicators never reached overbought territory during the week, another bearish sign. Also note that Monday’s action was strikingly similar to Friday’s.
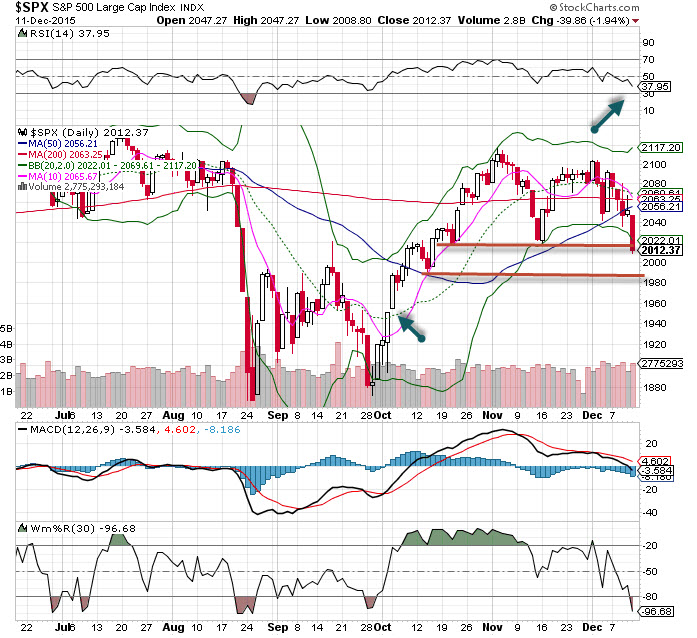
The daily chart shows the index closing on the lows for the week while also taking out the November lows. The Relative Strength Index (RSI) is nearly to the 30 area where significant bounces have occurred, yet we’ll wait for a bounce to happen first before making a move. This may coincide with a massive oversold reading and a spike in the VIX (which may be occurring now). Below there is a gap that is likely to be filled eventually (see the arrow), but first up, there is support at 1,985, and on top of that, strong support at 2020.
When massive selling occurs, turn to the charts and technicals for stock market analysis. Both will help you understand why traders are selling, and they can give you an edge and help you find options trading opportunities without an emotional bias or irrational response. Our job is to find good trades, and bank wins.
Copyright: thomaspajot / 123RF Stock Photo


