The retail sector was obliterated during the recent earnings season. The post-holiday period is often quiet for retailers, but winter 2019 was far worse that usual. One by one, retailers have been taken out back and shot. The retail ETF (XRT) is near multi-month lows, even though most markets are up double digits.
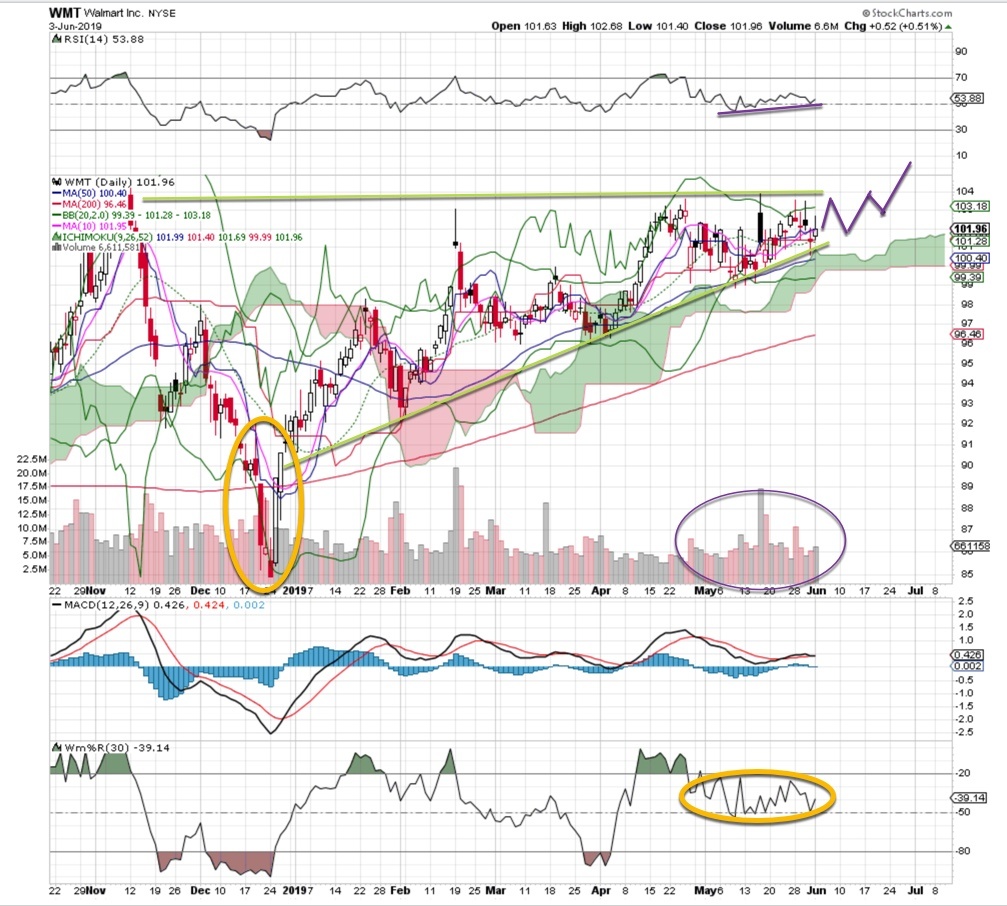
This brings us to the “least bad” of the group, Walmart. The stock has been nice and steady this year. It made a series of higher highs and higher lows, pushing it up against the all-time highs it reached in November 2018. As we head towards the apex, though, buyers must make a decision. Oftentimes, things collapse. Those sharp wedges are squeezed hard – and then the stock drops.
This name may be different, as some of the volume from lower levels has been robust. RSI shows higher lows on the chart, too. We like this stock.
Take a deeper dive into Walmart chart action (NYSE: WMT) and learn how to read the technicals. Get Bob Lang’s full analysis as he marks up our chart of the week.
Love what you’re learning in our market analysis? Don’t miss a single video! Get the latest chart action delivered directly to your inbox every week as Bob breaks down stocks to watch and potential trade options!
About Walmart (WMT)
Walmart Inc. is an American multinational retail corporation that operates a chain of hypermarkets, discount department stores, and grocery stores. Headquartered in Bentonville, Arkansas, the company was founded by Sam Walton in 1962.


